


Similar Questions
Explore conceptually related problems
Recommended Questions
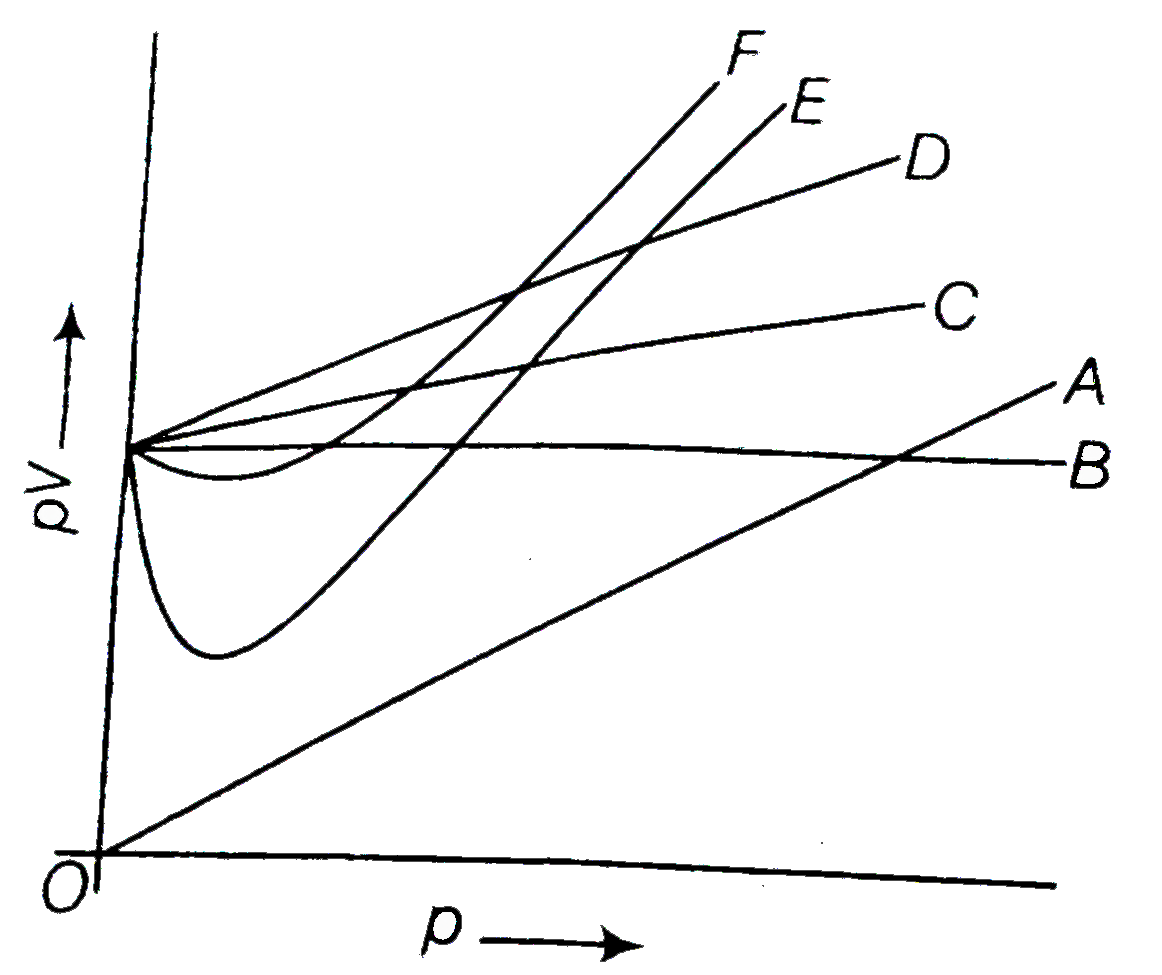
- Which curve in figure represents the curve of ideal gas ?
Text Solution
|
- The curves A and B in the figure shown P-V graphs for an isothermal an...
Text Solution
|
- The given curve represents the variation of temperature as a function ...
Text Solution
|
- Which of the following curve is correct for an ideal gas ?
Text Solution
|
- Which curve in figure represents the curve of ideal gas ?
Text Solution
|
- निम्नलिखित कथन सत्य है अथवा असत्य? चित्र में दो वक्र A तथा B एक आदर्श...
Text Solution
|
- Which curve in the following graph represents the curve of ideal gas ?
Text Solution
|
- चित्र में कौन-सा वक्र आदर्श गैस के वक्र को दर्शाता है ?
Text Solution
|
- Which curve in figure represents the curve of ideal gas ?
Text Solution
|