


Similar Questions
Explore conceptually related problems
Recommended Questions
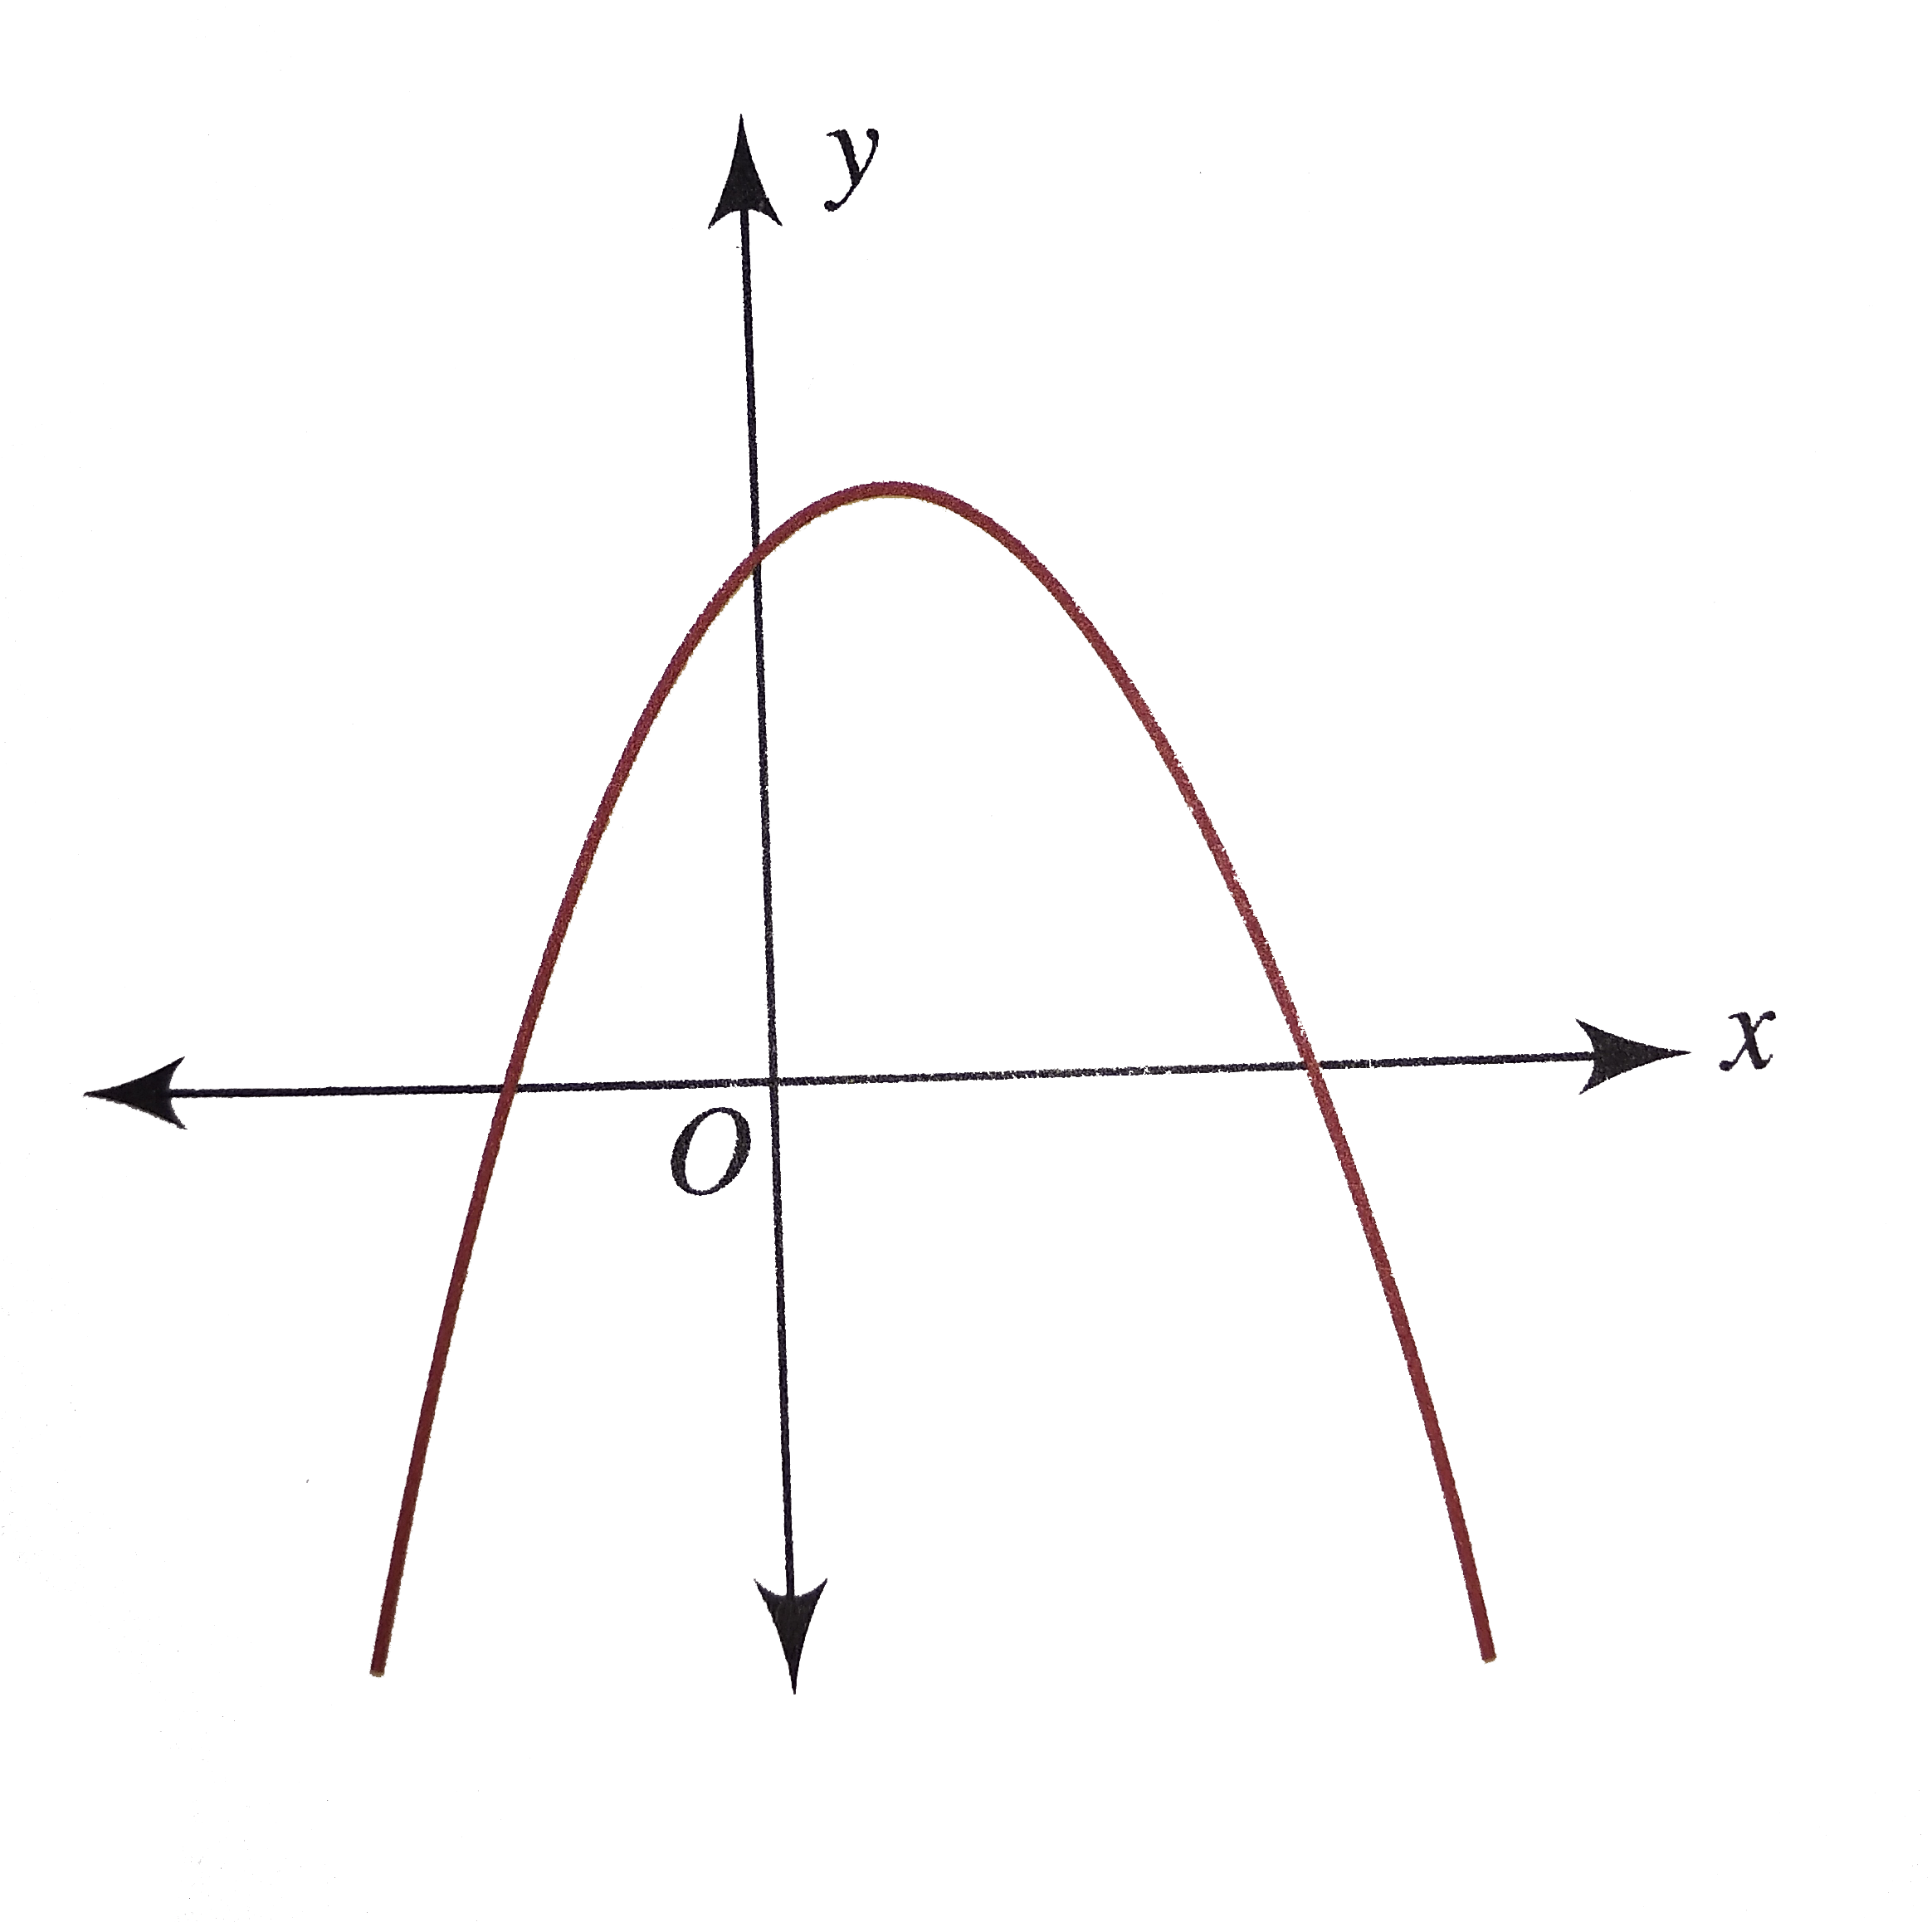
- The following figure shows the graph of f(x)= ax^(2)+ bx+c, find the s...
Text Solution
|
- In the given figure (not to scale), O is the centre of the circle. A,B...
Text Solution
|
- How many lines of symmetry does the above figure have ? <img src="http...
Text Solution
|
- Which of the following are correct chain isomers of butane ? (i) <img ...
Text Solution
|
- Determine the point of symmetry of a regular hexagon. <img src="htt...
Text Solution
|
- Dtermine the images of the following figure about the given line : ...
Text Solution
|
- Match the following Column A to Column B
Text Solution
|
- Match the following Column A to Column B
Text Solution
|
- Match the following Column A to Column B
Text Solution
|