


Similar Questions
Explore conceptually related problems
Recommended Questions
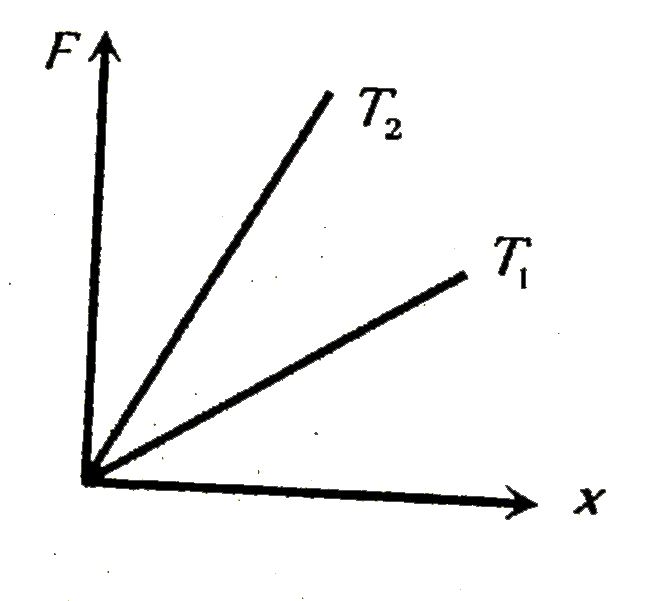
- The diagram shows the change x in the length of the uniform wire cause...
Text Solution
|
- A uniform rod of length l is rotating with constant angular speed omeg...
Text Solution
|
- The variation of length of two metal rods A and B with change in tempe...
Text Solution
|
- The graph shows the change 'Delta l' in the length of a thin uniform w...
Text Solution
|
- The diagram shows the change x in the length of the uniform wire cause...
Text Solution
|
- A cyclic process is shown in the p-T diagram. Which of the curves show...
Text Solution
|
- A cyclic process is shown on the p-T diagram . Which of the curves sho...
Text Solution
|
- The correct graph which shows the variation of paramagnetic susceptibi...
Text Solution
|
- A uniform rod of length l is rotating with constant angular speed omeg...
Text Solution
|