A
B
C
D
Text Solution
Verified by Experts
The correct Answer is:


Similar Questions
Explore conceptually related problems
Recommended Questions
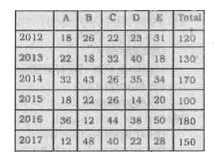
- The given table shows the number (in thousands) of cars of five differ...
Text Solution
|
- The given table shows the number (in thousands) of cars of five differ...
Text Solution
|
- The given table shows the number (in thousands) of cars of five differ...
Text Solution
|
- The given table shows the number (in thousands) of cars of five differ...
Text Solution
|
- The given table shows the number (in thousands) of cars of five differ...
Text Solution
|
- The table given here shows production of five types of cars by a compa...
Text Solution
|
- The table shows the production of different types of cars (in thousand...
Text Solution
|
- The table shows the production of different types of cars by a company...
Text Solution
|
- The table shows the production of different types of cars by a company...
Text Solution
|