A
B
C
D
Text Solution
Verified by Experts
The correct Answer is:


Topper's Solved these Questions
Similar Questions
Explore conceptually related problems
ARIHANT SSC-DATA TABLE -EXERCISE BASE LEVEL QUESTIONS
- What is the ratio of the total number of students studying Science fro...
Text Solution
|
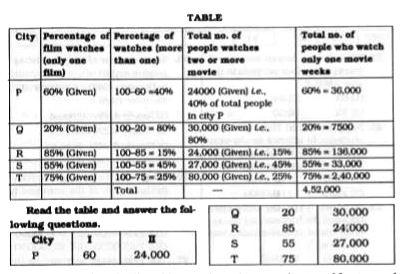
- A survey of film watching habits of people living in five cities P, Q,...
Text Solution
|
- A survey of film watching habits of people living in five cities P, Q,...
Text Solution
|
- A survey of film watching habits of people living in five cities P, Q,...
Text Solution
|
- A survey of film watching habits of people living in five cities P, Q,...
Text Solution
|
- A survey of film watching habits of people living in five cities P, Q,...
Text Solution
|
- In how many years, the supply (in million tons) of sugar was more than...
Text Solution
|
- The average surplus (in million tons) of sugar for the period 2008 to ...
Text Solution
|
- The surplus of sugar was lowest for the year
Text Solution
|
- The percentage increase in demand of sugar was the lowest as compared ...
Text Solution
|
- In which year, the production of cars of all types taken together was ...
Text Solution
|
- In which year, the total production of cars of types P and Q together ...
Text Solution
|
- During the period 1989 - 94, which type of cars had a continuous incre...
Text Solution
|
- The production of which type of cars was 25 % of the total production ...
Text Solution
|
- The per cent increase in total production of all types of cars in 1992...
Text Solution
|
- The number of people who read at least one type of magazine and are ov...
Text Solution
|
- The number of people in the age group 10-15 who reads only one type of...
Text Solution
|
- The number of females in the age group 16 - 35 who do not read sports ...
Text Solution
|
- The number of males in the age group 16 - 35 who do not read film maga...
Text Solution
|
- What per cent of people over 35 yr do not read either type of magazine...
Text Solution
|