


Similar Questions
Explore conceptually related problems
Recommended Questions
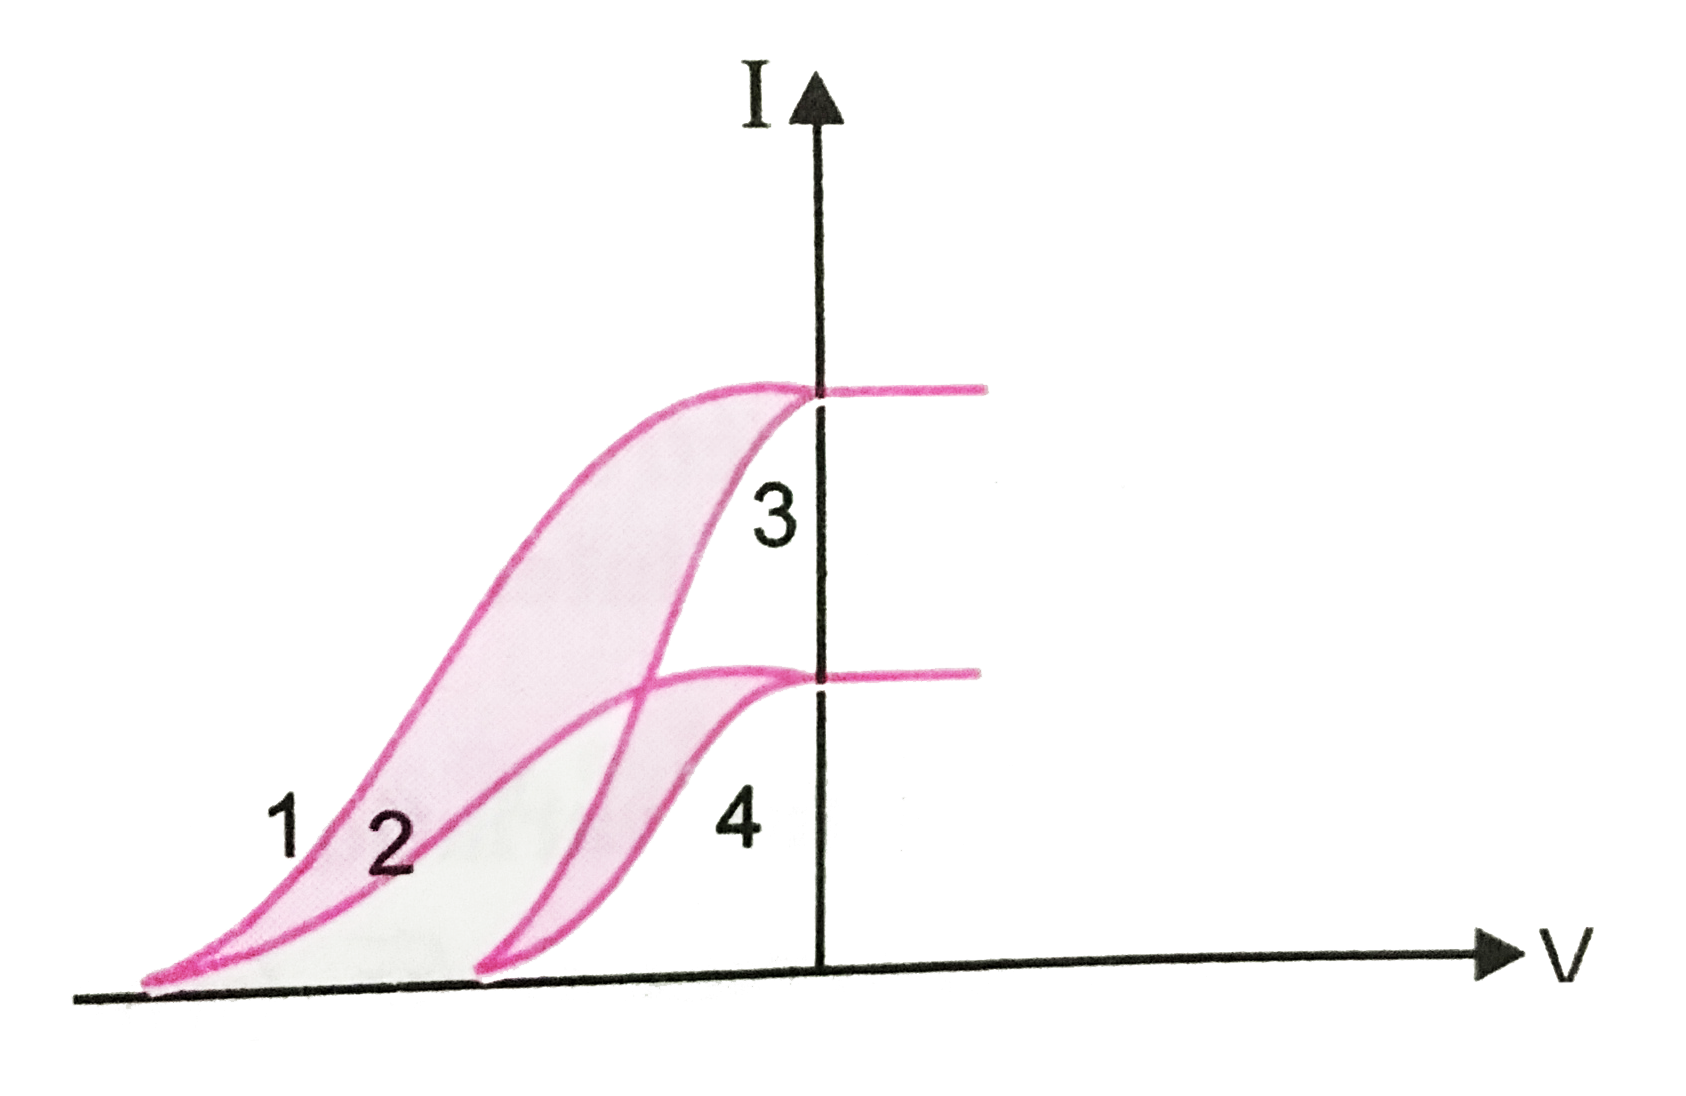
- The graph of Fig. shows the variation of photoelectric current (I) ver...
Text Solution
|
- The graph of Fig. shows the variation of photoelectric current (I) ver...
Text Solution
|
- The Fig shows a plot of three curves a, b, c showing the variation of ...
Text Solution
|
- Draw a plot showing the variation of photoelectric current versus the ...
Text Solution
|
- In a plot of photoelectric current versus anode potential, how does ...
Text Solution
|
- Darw graphs showing variation of photoelctric current with applied vol...
Text Solution
|
- Draw graphs showing variation of photoelectric current with applied vo...
Text Solution
|
- निम्न ग्राफ दो विभिन्न प्रकाश संवेदी पदार्थो एवं विभिन्न तीव्रताओं के ...
Text Solution
|
- Draw a graph showing variation of photoelectric current (I) with anode...
Text Solution
|