


Similar Questions
Explore conceptually related problems
Recommended Questions
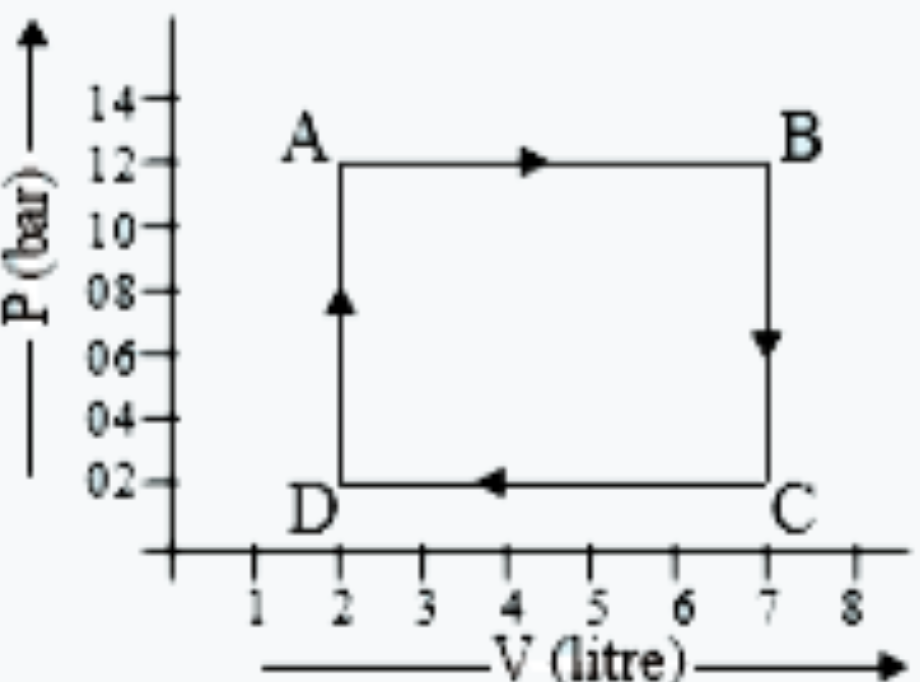
- The diagram shows a P - V graph of a thermodynamic behaviour of an ide...
Text Solution
|
- The figure shows P - V diagram of a thermodynamic cycle The work ...
Text Solution
|
- The diagram shows a PV graph of a thermodynamic behavious of an ideal ...
Text Solution
|
- In the adjoining diagram, the p-V graph of an ideal gas is shown. Find...
Text Solution
|
- संलग्न चित्र में, एक आदर्श गैस की ऊष्मागतिकीय प्रक्रियाओं का P-V। ग्रा...
Text Solution
|
- संलग्न चित्र में, एक आदर्श गैस की ऊष्मागतिकीय प्रक्रियाओं का P-V। ग्रा...
Text Solution
|
- चित्र में, किसी गैस के लिए दाब-आयतन आरेख (P-V diagram) दर्शावा गया है...
Text Solution
|
- चित्र में, किसी गैस के लिए दाब-आयतन आरेख (P-V diagram) दर्शाया गया है...
Text Solution
|
- An ideal gas is taken around the cycle ABCA as shown in the P-V diagra...
Text Solution
|