Text Solution
Verified by Experts


Topper's Solved these Questions
Similar Questions
Explore conceptually related problems
NCERT TELUGU-MOTION IN A STRAIGHT LINE-EXERCISES
- A drunkard walking in a narrow lane takes 5 steps forward and 3 steps ...
Text Solution
|
- A jet airplane travelling at the speed of 500 km h^(-1) ejects its pro...
Text Solution
|
- A car moving along a straight highway with speed of 126 km h^(-1) is b...
Text Solution
|
- Two trains A and B of length 400 m each are moving on two parallel tra...
Text Solution
|
- On a two-lane road, car A is travelling with a speed of 36 km h^(-1). ...
Text Solution
|
- Two towns A and B are connected by a regular bus service with a bus le...
Text Solution
|
- A player throws a ball upwards with an initial speed of 29.4 ms^(-1). ...
Text Solution
|
- Read each statement below carefully and state with reasons and example...
Text Solution
|
- A ball is dropped from a height of 90 m on a floor. At each collision ...
Text Solution
|
- Explain clearly, with examples, the distinction between : (a) magnit...
Text Solution
|
- A man walks on a straight road from his home to a market 2.5 km away w...
Text Solution
|
- We have carefully distinguished between average speed and magnitude of...
Text Solution
|
- Look at the graphs (a) to (d) (Fig.) carefully and state, with reasons...
Text Solution
|
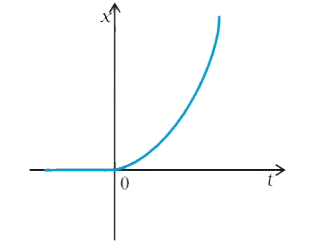
- Figure. shows the x-t plot of one-dimensional motion of a particle. Is...
Text Solution
|
- A police van moving on a highway with a speed of 30 km h^(-1) fires a ...
Text Solution
|
- Suggest a suitable physical situation for each of the following graphs...
Text Solution
|
- Figure. gives the x-t plot of a particle executing one-dimensional sim...
Text Solution
|
- Figure. gives the x-t plot of a particle in one-dimensional motion. Th...
Text Solution
|
- Figure. gives a speed-time graph of a particle in motion along a const...
Text Solution
|
- A three-wheeler starts from rest, accelerates uniformly with 1 ms^(-2)...
Text Solution
|