


Similar Questions
Explore conceptually related problems
Recommended Questions
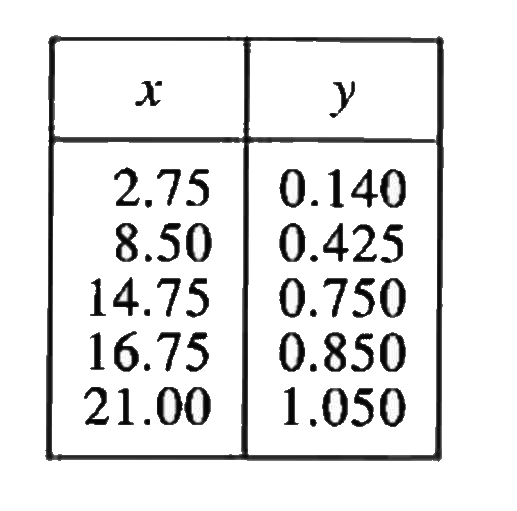
- The table below gives experimental data value for variables x and y. T...
Text Solution
|
- x varies directly as y.If constant of variation k=40 and y=400 find x
Text Solution
|
- Determine the point of symmetry of a regular hexagon. <img src="htt...
Text Solution
|
- Match the following Column A to Column B
Text Solution
|
- The inequation represented by the graph given below is : <img src="htt...
Text Solution
|
- The inequation that best describes the graph given below is <img src=...
Text Solution
|
- The inequation that best describes the following graph is <img src="h...
Text Solution
|
- In Fig, find the value of x. ltimg src="https://d10lpgp6xz60nq.cloud...
Text Solution
|
- At x=0, value of (dy)/(dx) is : ltimg src="https://d10lpgp6xz60nq.clou...
Text Solution
|