


Similar Questions
Explore conceptually related problems
Recommended Questions
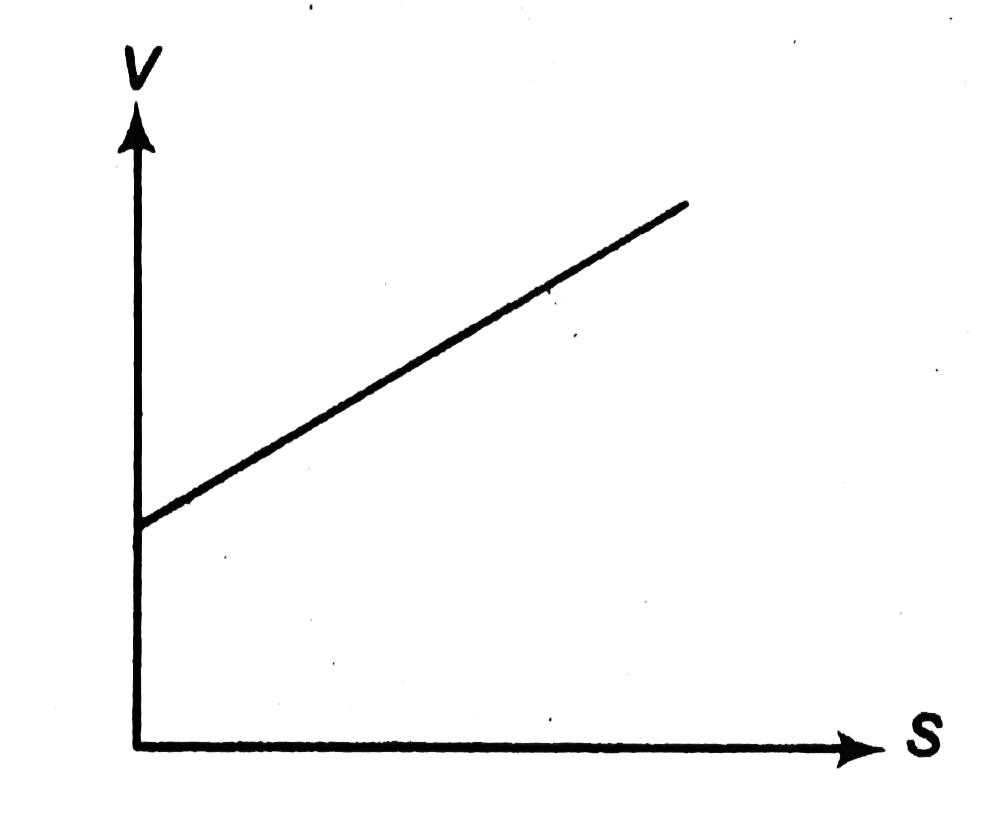
- Corresponding to given v-s graph of a particle moving in a straight li...
Text Solution
|
- Corresponding to given v-s graph of a particle moving in a straight li...
Text Solution
|
- Velocity-time graph of a particle moving in a straight line is shown i...
Text Solution
|
- Velocity-time graph of a particle moving in a straight line is shown i...
Text Solution
|
- Velocity-time graph of a particle moving in a straight line is shown i...
Text Solution
|
- Velocity (v) versus displacement (s) graph of a particle moving in a s...
Text Solution
|
- Acceleration (a) -displacement (s) graph of a particle moving in a str...
Text Solution
|
- Acceleration (a)-displacement(s) graph of a particle moving in a strai...
Text Solution
|
- Acceleration v/s displacement graph of a particle moving in a straight...
Text Solution
|