


Similar Questions
Explore conceptually related problems
Recommended Questions
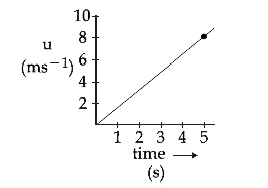
- The speed verses time graph for a particle is shown in the figure. The...
Text Solution
|
- The distance travelled by a particle in time t is given by s=(2.5m/s^2...
Text Solution
|
- Figure shows the speed versus time graph for a particle. Find the dist...
Text Solution
|
- A particle is moving along the x-axis such that s=6t-t^(2) , where s i...
Text Solution
|
- Suppose that a particle mvoes on a straight line so that is velocity a...
Text Solution
|
- The speed-time graph of a particle moving along a fixed direction as s...
Text Solution
|
- A graph of acceleration versus time of a particle starting from rest a...
Text Solution
|
- The position - time graph for a particle moving along a straight line ...
Text Solution
|
- The position (x) - time (t) graph for a particle moving along a straig...
Text Solution
|