


Similar Questions
Explore conceptually related problems
Recommended Questions
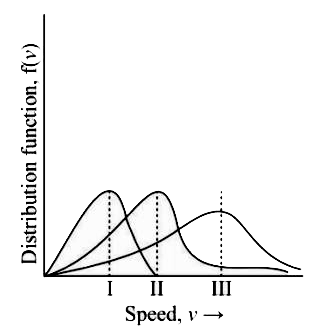
- Points I, II and III in the following plot respectively correspond to ...
Text Solution
|
- v(rms), v(av) and v(mp) are root mean square average and most probable...
Text Solution
|
- P-V plots for two gases during adiabatic expansion are shown in figure...
Text Solution
|
- For gas at a temperature T the root-mean-square speed v(rms), the most...
Text Solution
|
- The relation between rms velocity, v(rms) and the most probable veloci...
Text Solution
|
- In the phase diagram showns, the point Q corresponds to the triple...
Text Solution
|
- Points I, II and III in the following plot respectively correspond to ...
Text Solution
|
- V(av), V(rms) and V(mp) are average speed, root mean square speed and ...
Text Solution
|
- आरेख में बिन्दु I, II तथा III क्रमशः इनसे सम्बन्धित है, (V"mp": प्रायि...
Text Solution
|