


Topper's Solved these Questions
JEE ADVANCED
JEE ADVANCED PREVIOUS YEAR|Exercise SECTION 3 PARAGRAPH|4 VideosJEE ADVANCED
JEE ADVANCED PREVIOUS YEAR|Exercise CHEMISTRY SECTION - I : Single correct Answer Type|8 VideosJEE ADVANCED
JEE ADVANCED PREVIOUS YEAR|Exercise SECTION 1|6 VideosJEE (ADVANCED ) 2020
JEE ADVANCED PREVIOUS YEAR|Exercise SECTION -III|6 VideosJEE ADVANCED 2020
JEE ADVANCED PREVIOUS YEAR|Exercise SECTION-3|6 Videos
Similar Questions
Explore conceptually related problems
JEE ADVANCED PREVIOUS YEAR-JEE ADVANCED-SECTION 2
- Among the species given below, the total number of diamagnetic species...
Text Solution
|
- The ammonia prepared by treating ammonium sulphate with calcium hydrox...
Text Solution
|
- For the electrochemical cell, Mg(s)|Mg^(2+)(aq,1 M)||Cu^(2+)(aq.1 M) C...
Text Solution
|
- A closed tank has two compartments A and B, both filled with oxygen (a...
Text Solution
|
- Liquids A and B form ideal solution over the entire range of compositi...
Text Solution
|
- The solubility of a salt of weak acid (AB) at pH 3 is Y xx 10^(-3) "...
Text Solution
|
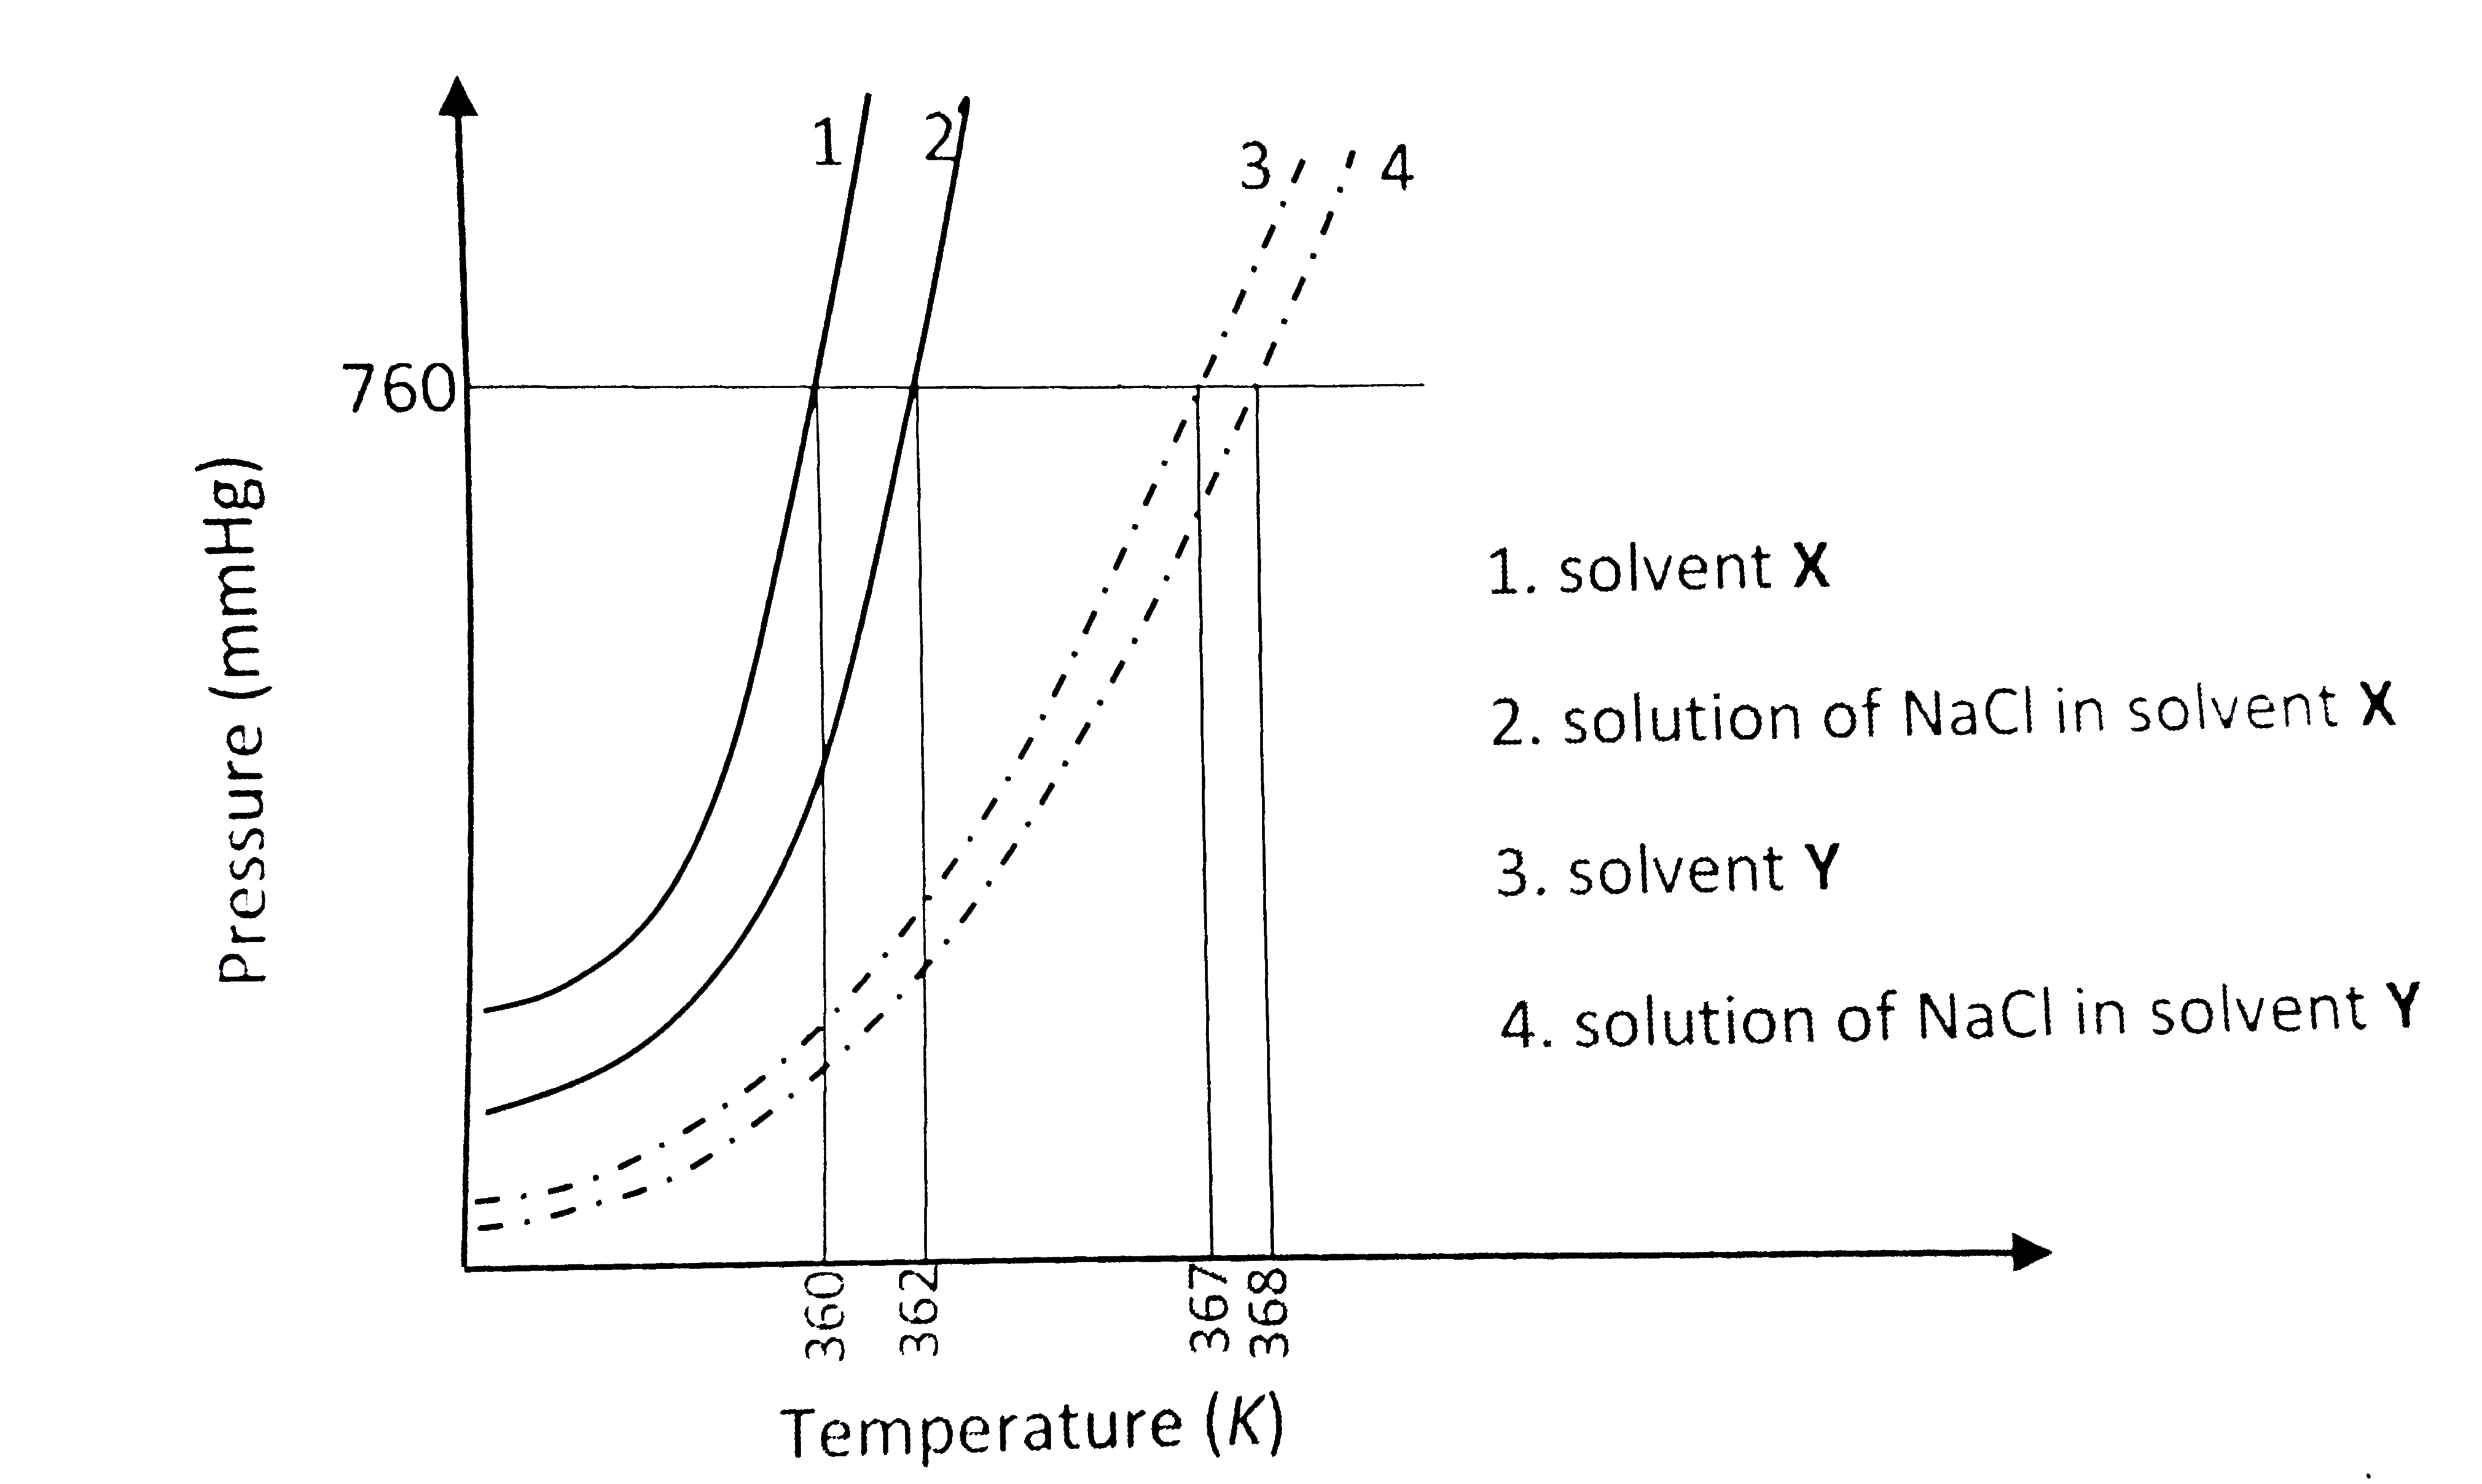
- The plot given below shows P -T curves (where P is the pressure and T ...
Text Solution
|