


Similar Questions
Explore conceptually related problems
Recommended Questions
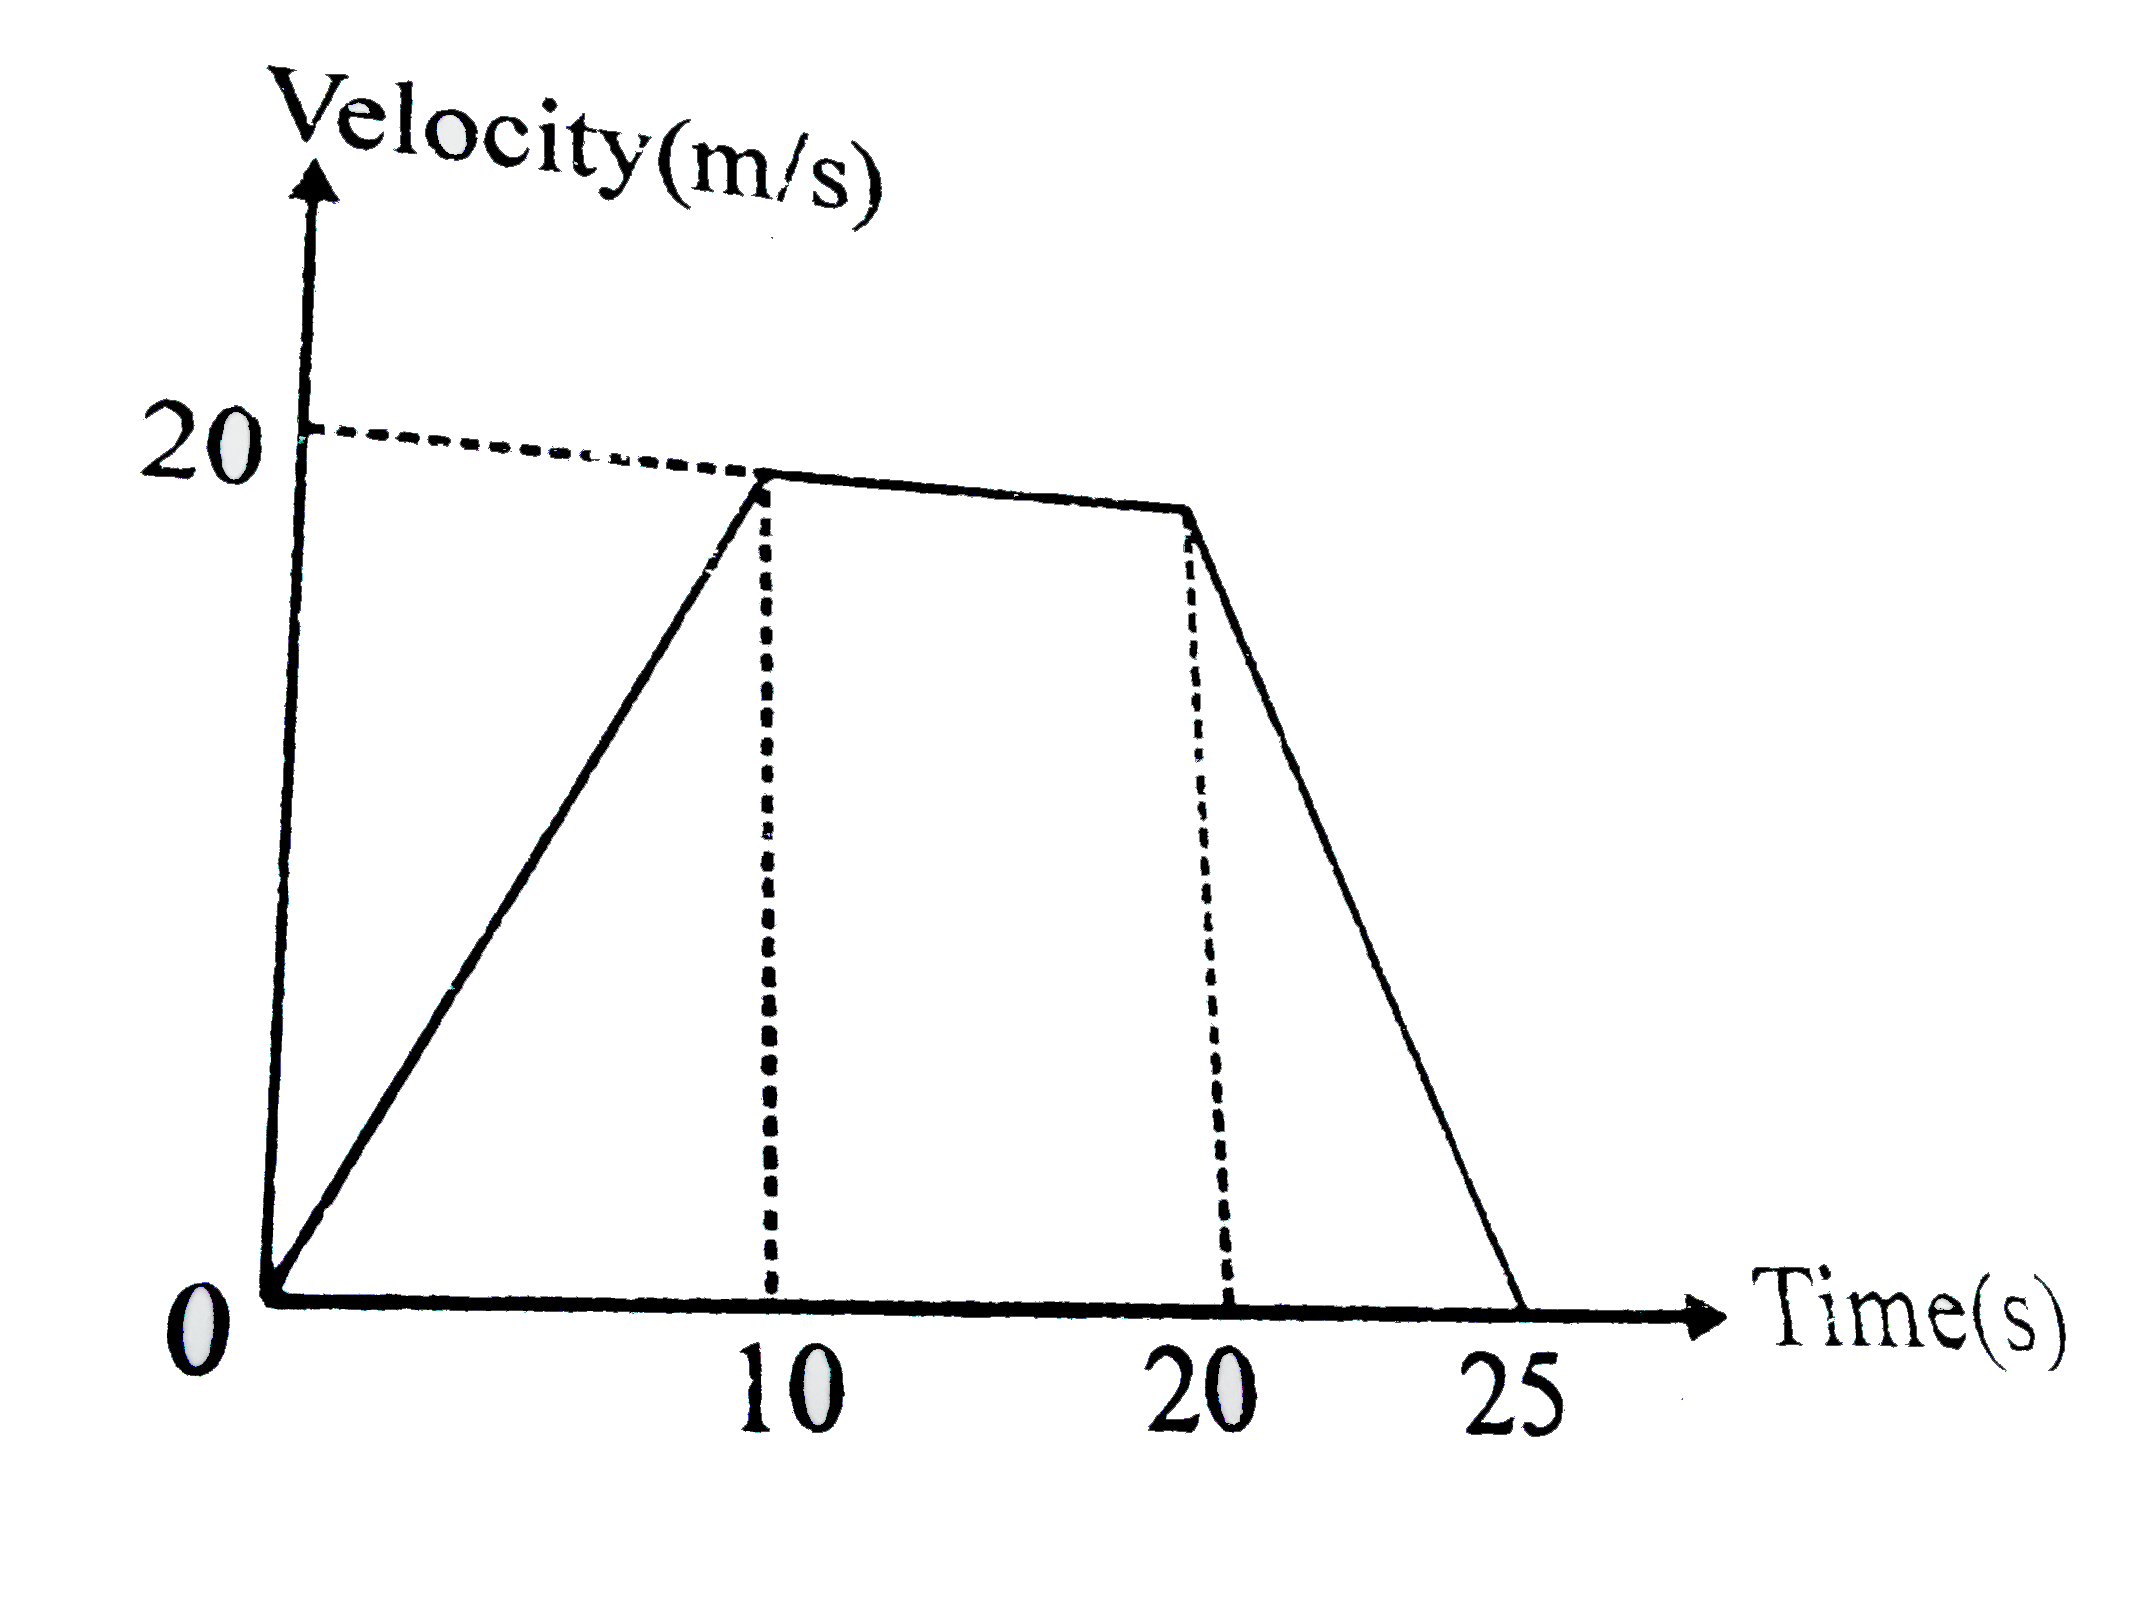
- The velocity-time graph of a car moving along a straight road is shown...
Text Solution
|
- The velocity-time graph of a car moving along a straight road is shown...
Text Solution
|
- A car is moving on a straight road. The velocity of the car varies wit...
Text Solution
|
- A car is moving on a straight road. The velocity of the car varies wit...
Text Solution
|
- The velocity-time graph of a car moving along a straight road is shown...
Text Solution
|
- A car moves along a straight path with variable velocity as shown in t...
Text Solution
|
- A car completes the first half of its journey with a velocity upsilon(...
Text Solution
|
- From the given displacement - time graph of two cars moving on a str...
Text Solution
|
- सीधी सड़क के अनुदिश एक कार का वेग समय आरेख चित्रानुसार है प्रथम 25 s मे...
Text Solution
|