Text Solution
Verified by Experts
The correct Answer is:


Topper's Solved these Questions
STRAIGHT LINES
NCERT TELUGU|Exercise EXERCISE 10.2|20 VideosSTRAIGHT LINES
NCERT TELUGU|Exercise EXERCISE 10.3|18 VideosSTRAIGHT LINES
NCERT TELUGU|Exercise Miscellaneous Exercise on Chapter 10|24 VideosSTATISTICS
NCERT TELUGU|Exercise Miscellaneous Exercise On Chapter 15|7 VideosTRIGONOMETRIC FUNCTIONS
NCERT TELUGU|Exercise MISCELLANEOUS EXAMPLES|10 Videos
Similar Questions
Explore conceptually related problems
NCERT TELUGU-STRAIGHT LINES-EXERCISE 10.1
- Find the product of the following pairs? 10p^(2)q,11pq^(2)
Text Solution
|
- Find the product of the following pairs? 9a^(2)b,2a^(3)b^(3)
Text Solution
|
- Find the distance between P (x(1), y(1)) " and " Q (x(2), y(2)) when...
Text Solution
|
- Find a point on the x-axis, which is equidistant from the points (7,6)...
Text Solution
|
- Find the slope of a line, which passes through the origin, and the mid...
Text Solution
|
- Without using the Pythagoras theorem, show that the points (4,4), (3, ...
Text Solution
|
- Find the product of the following pairs? 7x^(3)y^(2),9x^(4)y^(2)
Text Solution
|
- Find the value of x for which the points (x, -1) (2,1) and (4, 5) are...
Text Solution
|
- Without using distance formula, show that points (-2, -1) , (4, 0) , (...
Text Solution
|
- . Find the angle between the x-axis and the line joining the points (3...
Text Solution
|
- Find the product of the following pairs? 9p^(3)qr^(2),3pq^(4)
Text Solution
|
- A line passes through (x(1), y(1)) " and " (h, k) . If slope of the l...
Text Solution
|
- If three points (h, 0),(a, b) and (0, k) lie on a line, show that a/h...
Text Solution
|
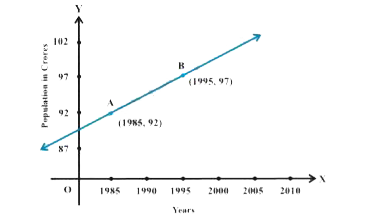
- Consider the following population and year graph (Fig 10.10), find the...
Text Solution
|