Text Solution
Verified by Experts
The correct Answer is:


Topper's Solved these Questions
STATISTICS
NCERT BANGLISH|Exercise EXERCISE 9.2|11 VideosSTATISTICS
NCERT BANGLISH|Exercise TRY THESE|5 VideosSTATISTICS
NCERT BANGLISH|Exercise THINK. DISCUSS AND WRITE|1 VideosREAL NUMBERS
NCERT BANGLISH|Exercise EXERCISE - 1.4|37 VideosSURFACE AREAS AND VOLUMES
NCERT BANGLISH|Exercise EXERCISE 10.4|12 Videos
Similar Questions
Explore conceptually related problems
NCERT BANGLISH-STATISTICS-EXERCISE 9.1
- Write the mark wise frequencies in the following frequency distributio...
Text Solution
|
- The blood group of 36 students of IX class are recorded as follows ...
Text Solution
|
- Three coins are tossed 30 times simultaneously. Each time the number o...
Text Solution
|
- A TV channel or organised SMS (Short Message Service) poll on prohibit...
Text Solution
|
- Represent the data in the adjacent bar graph as frequency distribution...
Text Solution
|
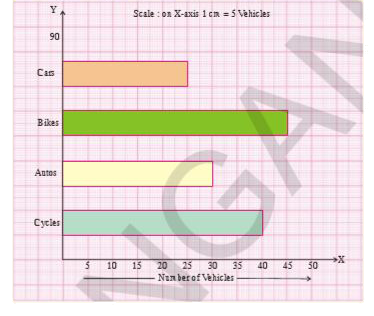
- Identify the scale used on the axes of the adjacent graph. Write the f...
Text Solution
|
- The marks of 30 students of a class of 10 in a test (out of 75) are gi...
Text Solution
|
- The electricity bills (in rupees) of 25 houses in a locality are given...
Text Solution
|
- A company manufactures car batteries of particular type. The life (in ...
Text Solution
|