Text Solution
Verified by Experts


Topper's Solved these Questions
Similar Questions
Explore conceptually related problems
NCERT BANGLISH-MOTION IN A STRAIGHT LINE-ADDITIONAL EXERCISES
- A boy standing on a stationary lift (open from above) throws a ball up...
Text Solution
|
- On a long horizontally moving belt (Fig.), a child runs to and fro wit...
Text Solution
|
- Two stones are thrown up simultaneously from the edge of a cliff 200 m...
Text Solution
|
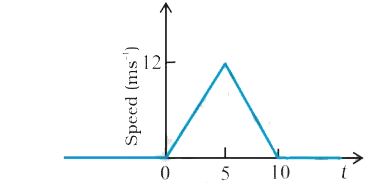
- The speed-time graph of a particle moving along a fixed direction is s...
Text Solution
|
- The velocity-time graph of a particle in one-dimensional motion is sho...
Text Solution
|