


Similar Questions
Explore conceptually related problems
Recommended Questions
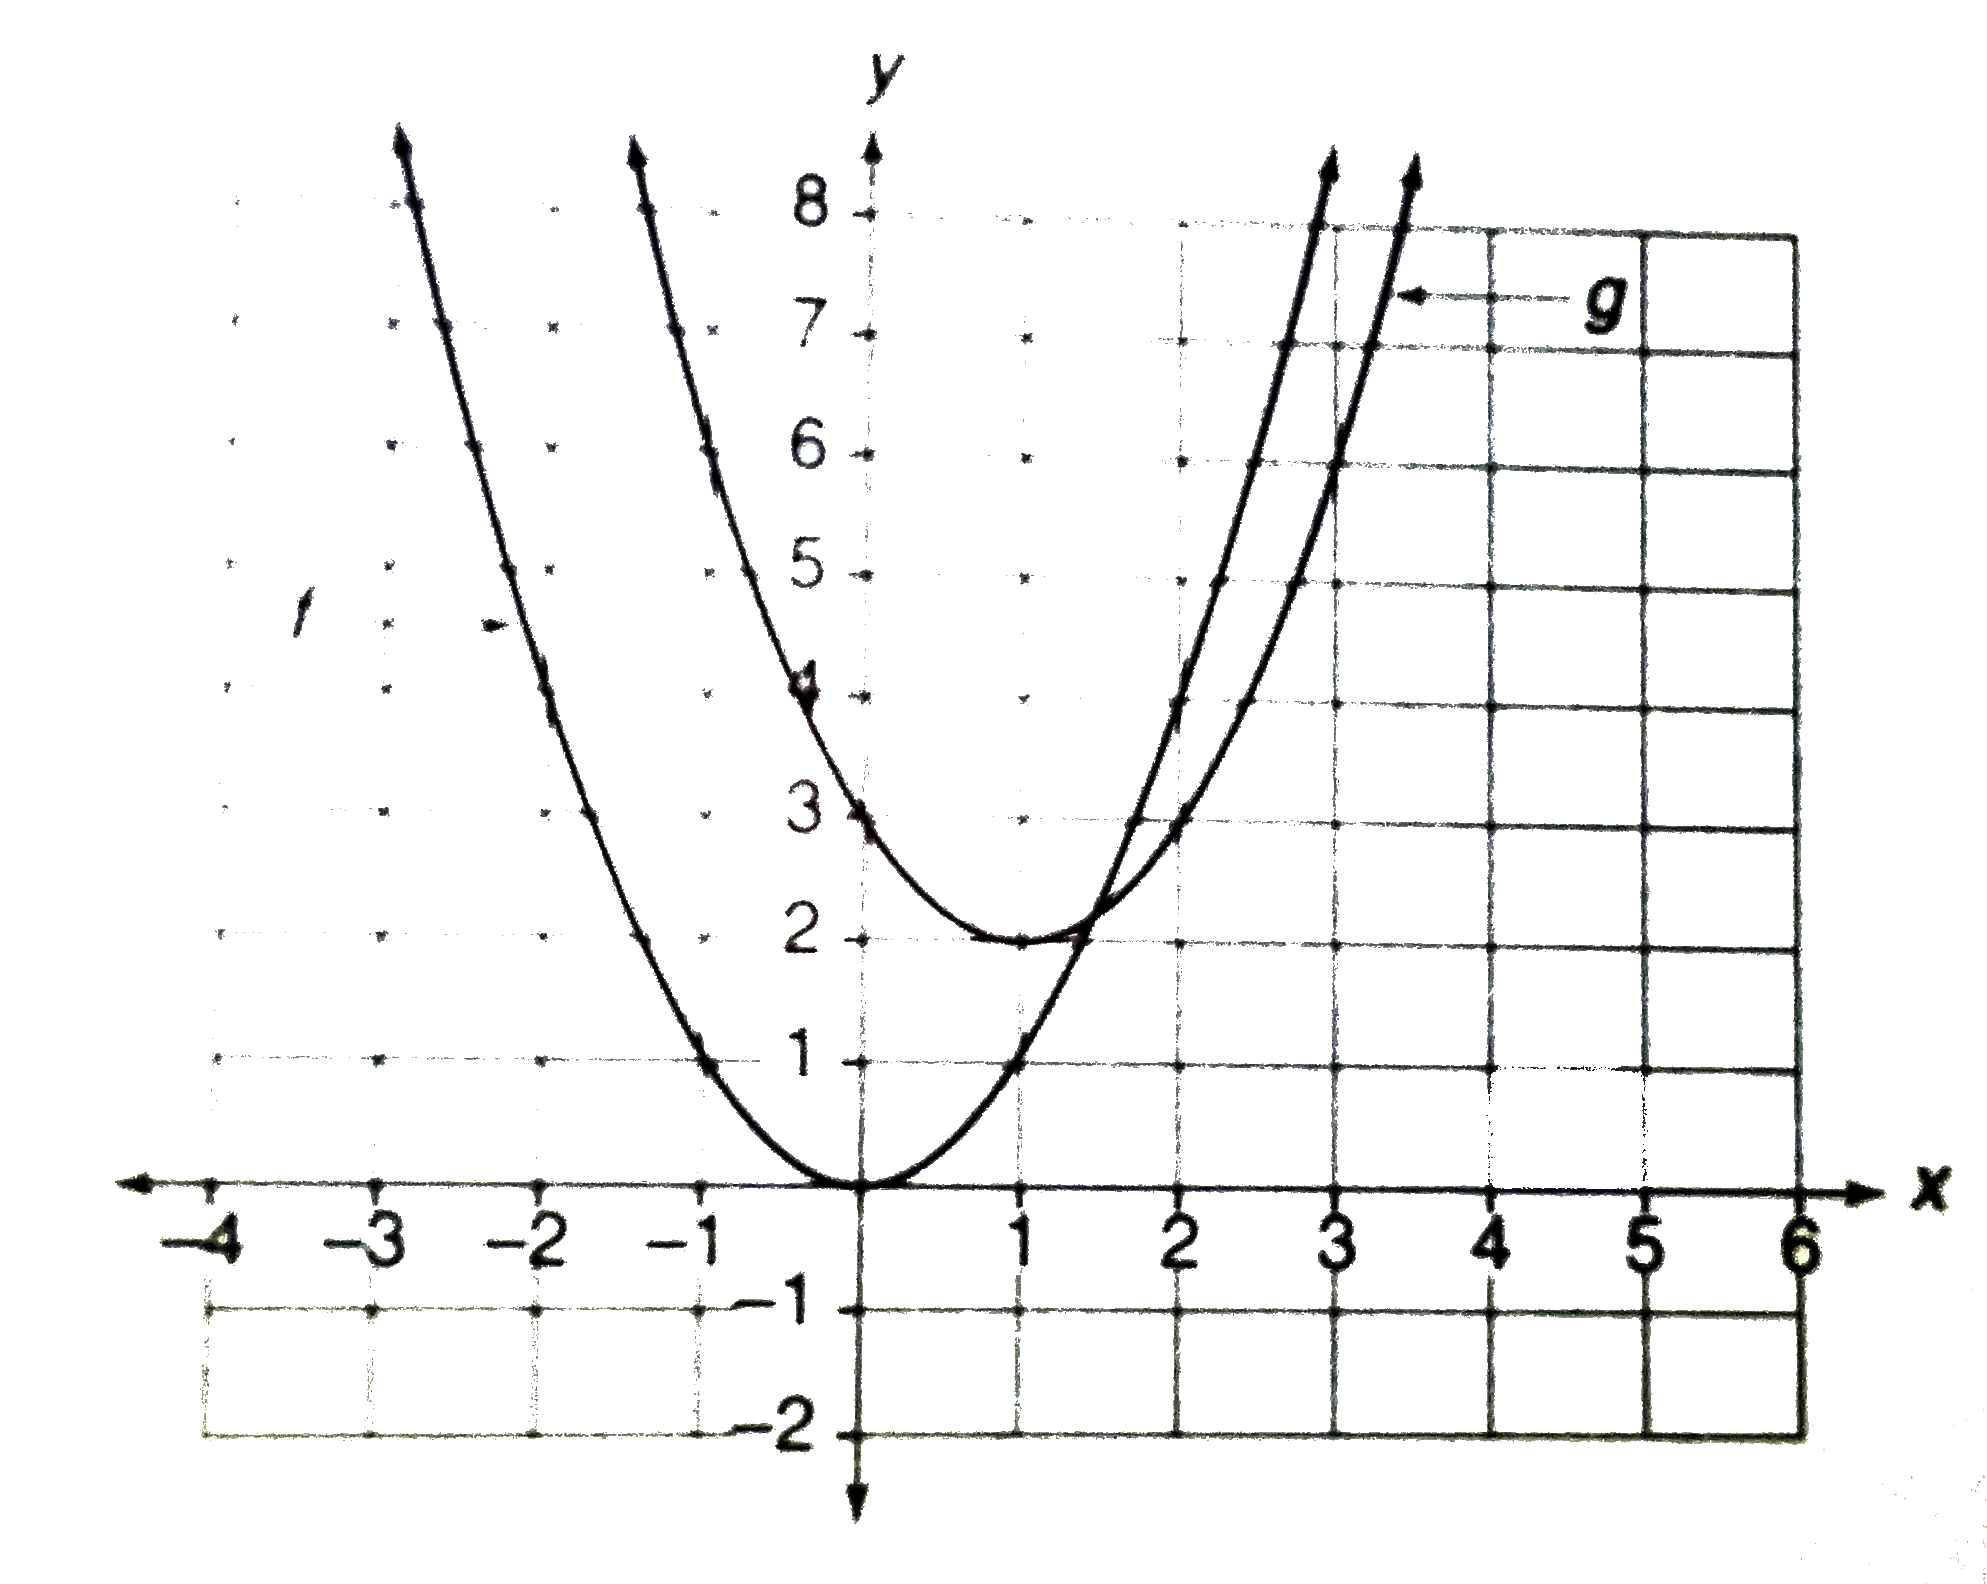
- The accompanying figure shows the graphs of functions f and g. If f is...
Text Solution
|
- Let h(x)=(fog)(x)+K where K is any constant . If d/dx(h(x))=-(sinx)/(c...
Text Solution
|
- Let f,g, h be differentiable functions of x. if Delta = |(f,g,h),((xf)...
Text Solution
|
- Let f be a twice differentiable function such that f''(x)=-f(x)" and...
Text Solution
|
- The accompanying figure shows the graphs of functions f and g. If f is...
Text Solution
|
- (##COLBODSATPT04E03013Q01.png" width="80%"> The function f and ...
Text Solution
|
- If f(x) be a function such that f(-x)= -f(x),g(x) be a function such t...
Text Solution
|
- Assertion: If f, g, h are real valued functions then f(g+h)=fg+fh. Re...
Text Solution
|
- f(x)=1-h(x), g(x)=1-k(x), h(x)=f(x)+1 f(x)=g(x)+1, k(x)=j(x)+1 Fin...
Text Solution
|