Home
Class 11
ECONOMICS
The following table shows birth and deat...

The following table shows birth and death rate in India according to the Census Reports between 1931 - 40 to 2016-17 (hypothetical figures). Present the data in te form of a multiple bar diagram.

Promotional Banner

Similar Questions

Explore conceptually related problems

The following table shows Production of Electricity from different Sources in India during 2014-15 to 2017-18 (hypothetical data). Present the data in a sub-divided bar diagram.

Following information relates to the exports form India to USSR and UK in the year 2015, 2016, 2017 and 2018 (hypothetical figures). Present it in the form of a table.

Following tables shows estimates of cost of production of certain commodities. Present the data in the form of sub divided bar diagram:

The following table gives data on the production and sales of a factory (in thousand rupees) between January and June. Present the information in the form of a two variable arithmetic-line graph. {:("Month","January","February","March","April","May","June"),("Production",5,7.5,5,10,12.5,15),("Sales",7.5,10,7.5,12.5,15,17.5):}

The following table shows the monthly expenditure of different families on different items : Represent the data in the form of a sub-divided bar diagram.

Following table gives hypothetical figures of exports from India during the years 2013-14 to 2017-18. Present the information in the form of a suitable graph. {:("Year",2013-14,2014-15,2015-16,2016-17,2017-18),("Exports (Rs. core)" ,600,640,670,780,900):}

The following table shows the total power shortage percentage in India from 1991-1997. Show the data in the form of a Bar graph taking shortage percentage for the years on the Y-axi and the years on X-axis.

The following table shows the total power shortage percentage in India from 1991-1997. Show the data in the form of a Bar graph taking shortage percentage for the years on the Y-axis and the years on the X-axis. If shortage percentage of power increases year by year, how will it affect on human life ? Explain.

Recommended Questions
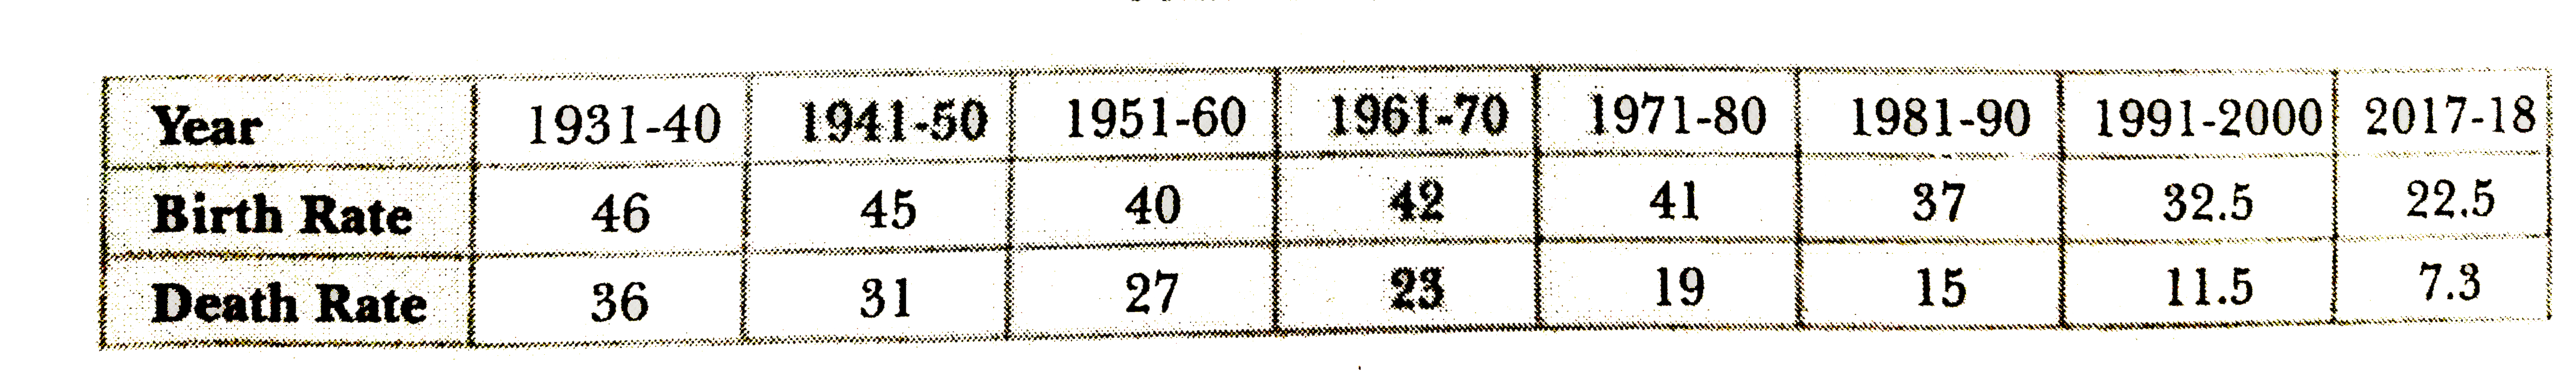
  1. The following table shows birth and death rate in India according to t...

    Text Solution

    |

  2. निएन्डरथल मानव की तुलना क्रोमैगनान मानव से कीजिए तथा वर्तमान मानव से क...

    Text Solution

    |

  3. पुनरावर्तन के सिद्धांत के अनुसार-

    Text Solution

    |

  4. उस कीटभक्षी पौधों का नाम लीखिए जो भारत के उत्तर -पूर्वी भाग की अब संकट...

    Text Solution

    |

  5. निचे दिए परिपथ में A और B के बिच तुल्य प्रतिरोध ज्ञात कीजिए ।

    Text Solution

    |

  6. संलग्न चित्र में, यदि धारामापी G में कोई विक्षेप नहीं हैं तो एक दशा मे...

    Text Solution

    |

  7. कारण सहित बताइए की धारामापी अपने वास्तविक रूप में धारा नापने के लिए क्...

    Text Solution

    |

  8. चित्रानुसार एक दण्ड चुम्बक मुक्त रूप से एक कुण्डली के बीच से होकर गिरत...

    Text Solution

    |

  9. प्रदत्त चित्र में दो लम्बे समान्तर धारावाही चालकों में 1 ऐम्पियर तथा ...

    Text Solution

    |