


Similar Questions
Explore conceptually related problems
Recommended Questions
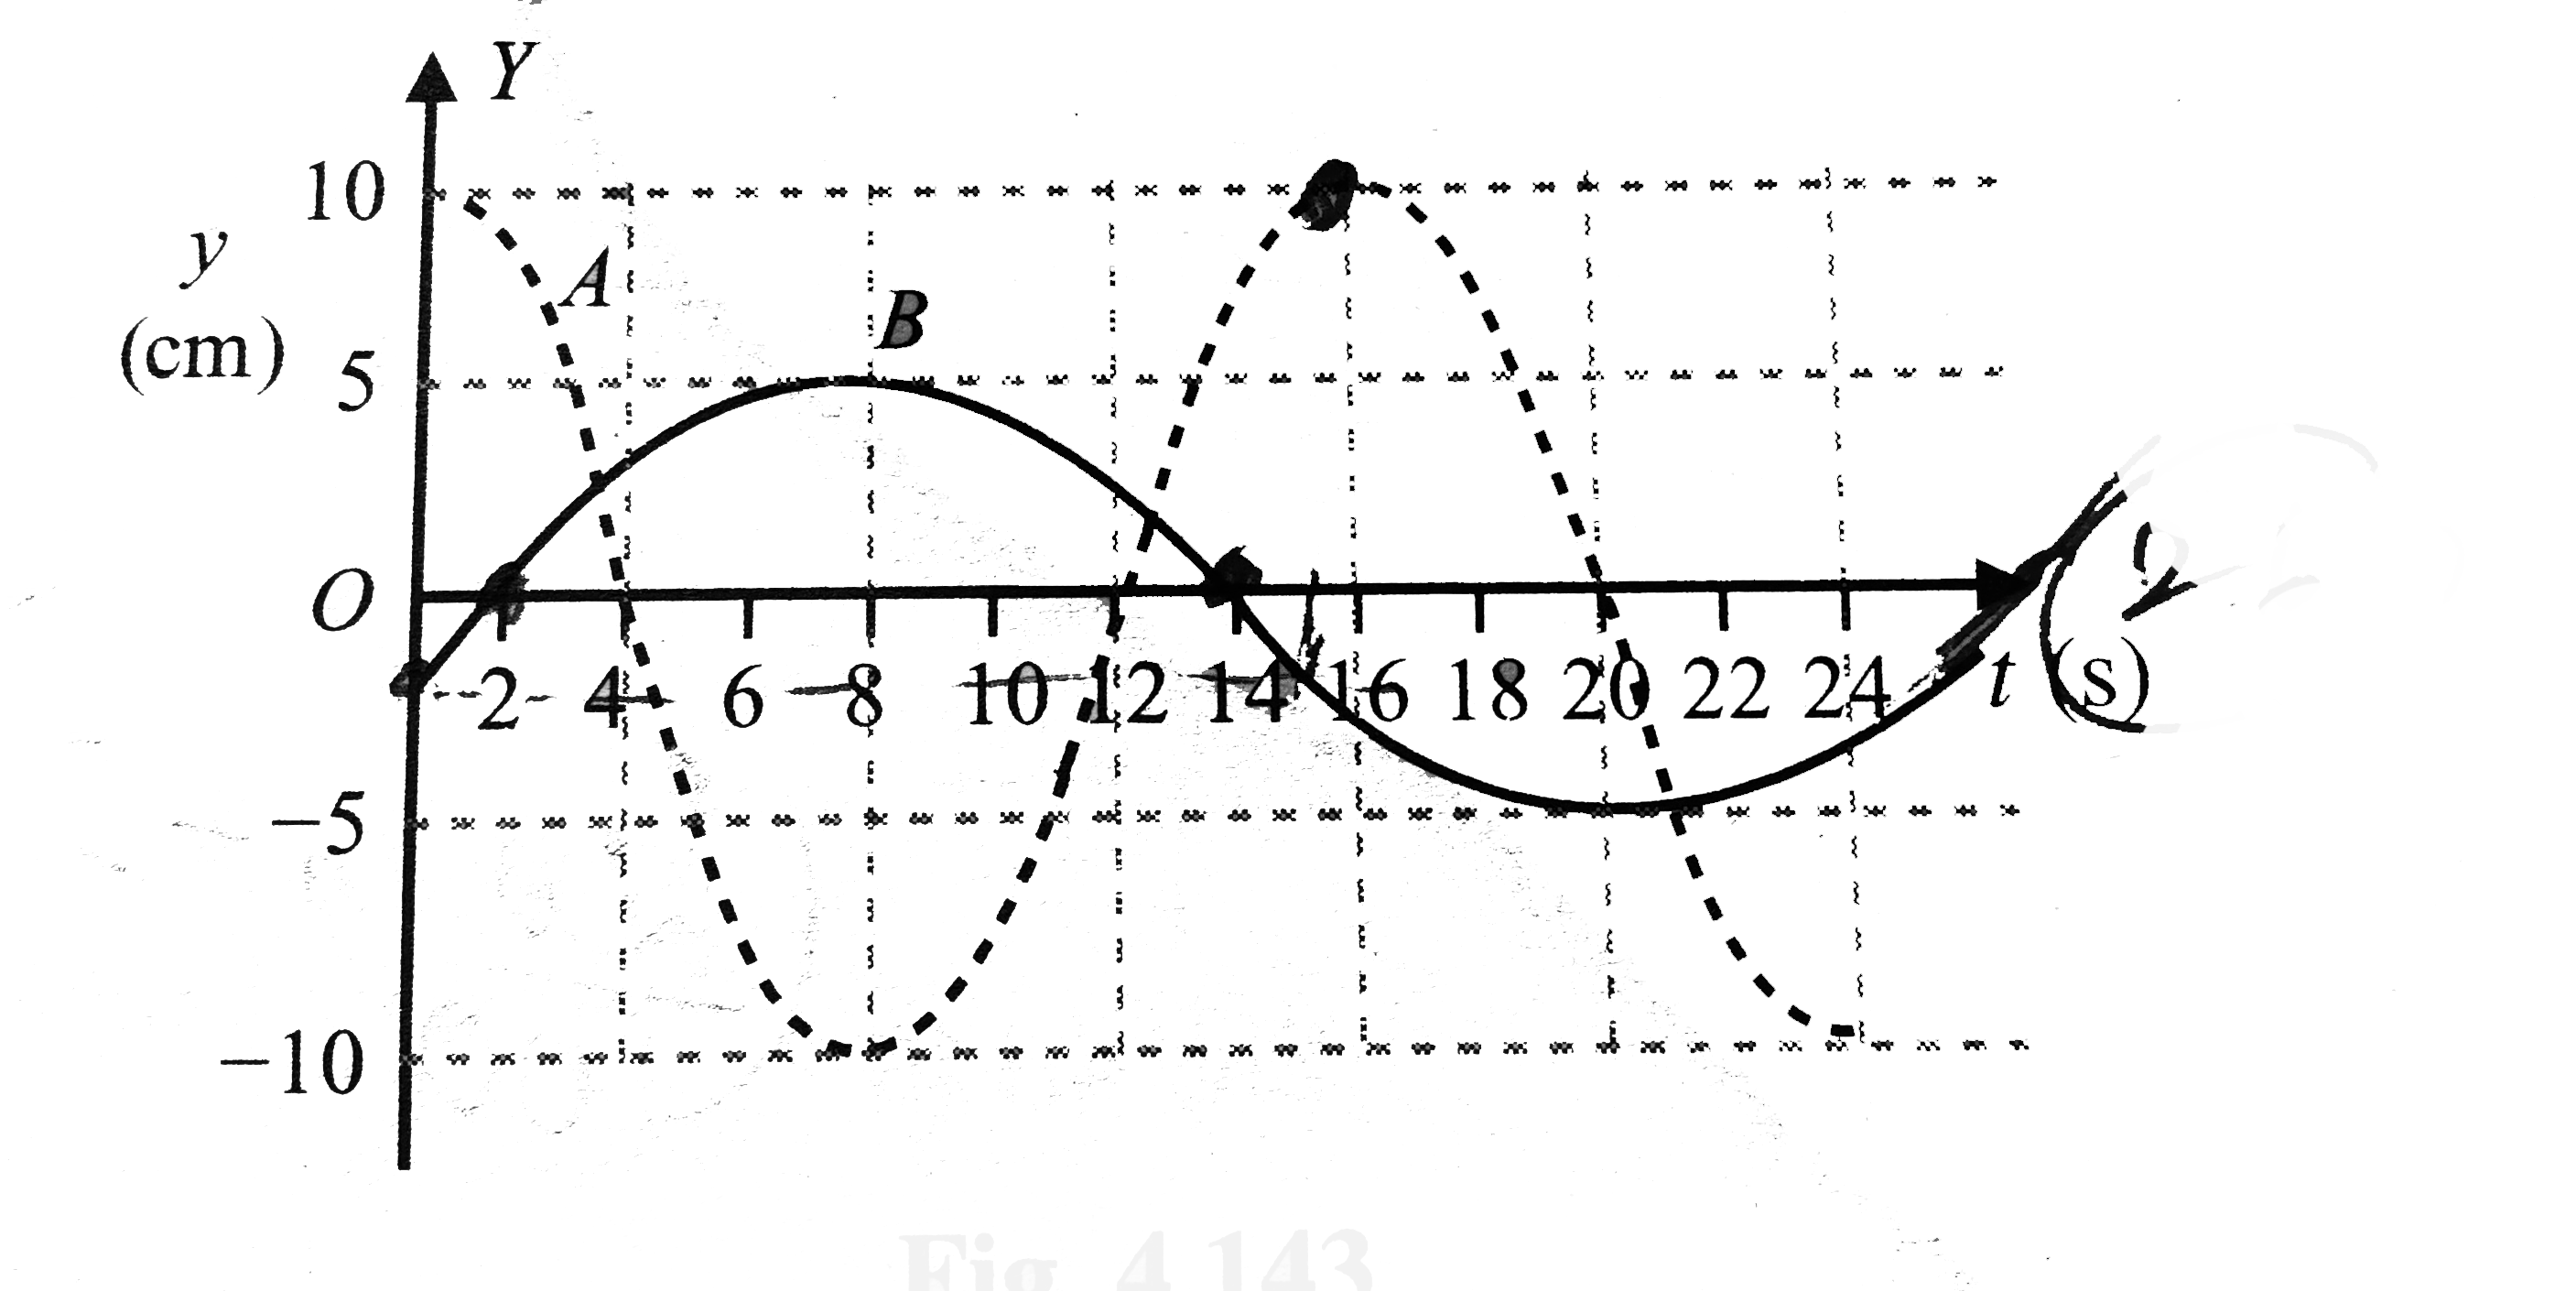
- The following figure shows the displacement versus time graph for two ...
Text Solution
|
- The following figure shows the displacement versus time graph for two ...
Text Solution
|
- The acceleration displacement graph of a particle executing simple har...
Text Solution
|
- The figure shows graph between velocity 'V' and displacement 'X' from ...
Text Solution
|
- A particle executes simple harmonic motion. Then the graph of veloctiy...
Text Solution
|
- Figure shows the graph of velocity versus displacement of a partciel e...
Text Solution
|
- The plot of velocity (v) versus displacement (x) of a particle executi...
Text Solution
|
- The following figure shows displacement versus time curve for a partic...
Text Solution
|
- Figure shows the displacement time graphs of two simple harmonic motio...
Text Solution
|