 .
.


Similar Questions
Explore conceptually related problems
Recommended Questions
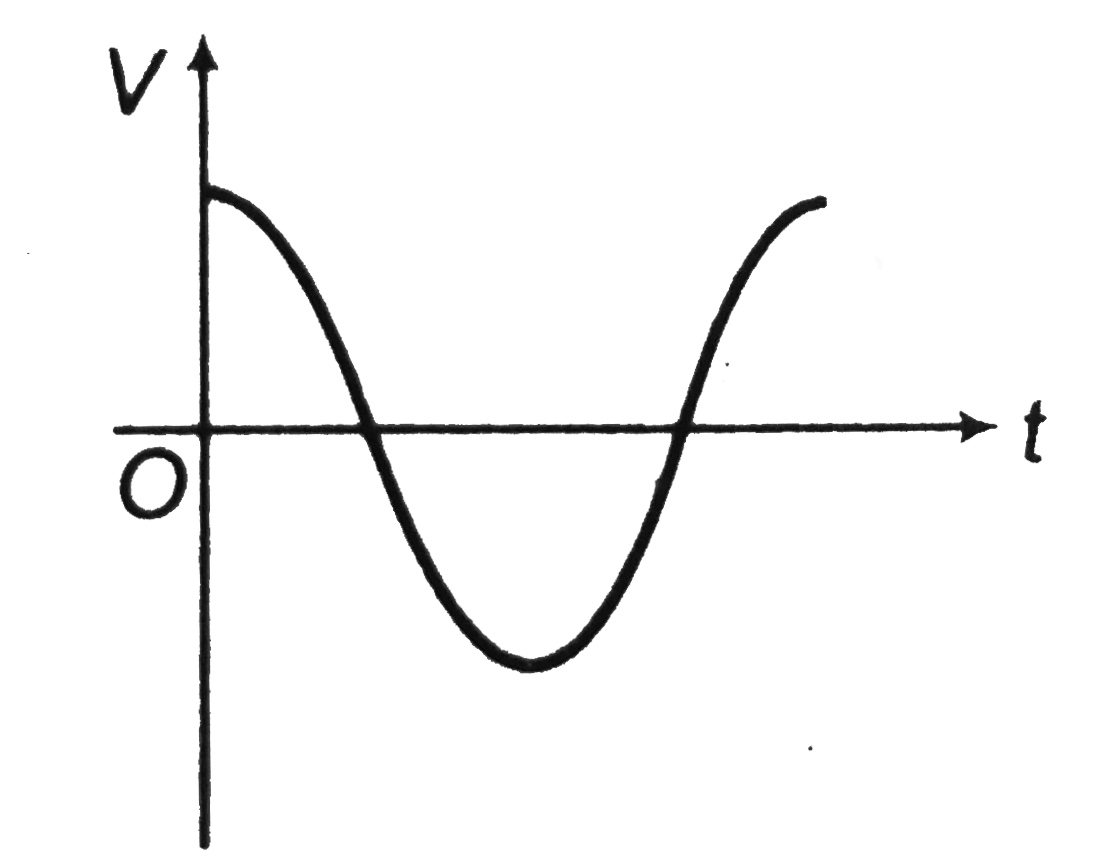
- The figure represents the voltage applied across a pure inductor. The ...
Text Solution
|
- The current through an inductor of 1H is given by i =31 sin t . Find t...
Text Solution
|
- The figure represents the voltage applied across a pure inductor. The ...
Text Solution
|
- The variation of temperature of a liquid with time is represented corr...
Text Solution
|
- The voltage across a pure inductor is represented by the following dia...
Text Solution
|
- In the circuit shown, the switch is closed at time t = 0. Which of the...
Text Solution
|
- Which graph correctly represents variation between relaxation time (t)...
Text Solution
|
- The current I in an inductance coil varies with time according to the ...
Text Solution
|
- If the current through an inductor of 2 H is given by I = t sin t A , ...
Text Solution
|