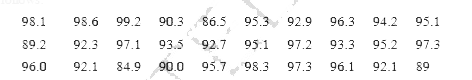
The relative humidity (in %) of a certain City for a September month of 30 days was as follows: (i) Construct a grouped frequency distribution table with classes 84-86, 86,-88 etc. (ii) What is the range of the data?
Text Solution
Verified by Experts
The correct Answer is:
(i) `(##NCERT_KAN_MAT_IX_C09_SLV_001_A01##)`, (ii) 14.3
Topper's Solved these Questions
STATISTICS
NCERT KANNAD|Exercise EXERCISE 9.1|9 Videos
STATISTICS
NCERT KANNAD|Exercise EXERCISE 9.2|10 Videos
REAL NUMBERS
NCERT KANNAD|Exercise EXERCISE - 1.4|37 Videos
SURFACE AREAS AND VOLUMES
NCERT KANNAD|Exercise EXERCISE 10.4|12 Videos
Similar Questions
Explore conceptually related problems
A company manufactures car batteries of particular type. The life (in years) of 40 batteries was recorded as follows: Construct a grouped frequency distribution table with exclusive classes for this data, using class intervals of size 0.5 starting from the interval 2-2.5.
A study was conducted to find out the concentration of sulphur dioxide in the air in parts per million (ppm) of a certain city. The data obtained for 30 days is as follows : You were asked to prepare a frequency distribution table, regarding the concentration of sulphur dioxide in the air in parts per million (ppm) of a certain city for 30 days . Using this table, find the probability of the concentration of sulphur dioxide in the interval 0.12-0.16 on any of these days.
The blood group of 36 students of IX class are recorded as follows Represent the data in the form of frequency distribution table. Which is the most common and which is the rarest blood group among these students?
Consider the following distribution: (i) Calculate the frequency of the class 30-40. (ii) Calculate the class mark of the class 10-25
The blood groups of 30 students of class VIII are recorded as follows represent this data in the form of frequency distribution table. Find our which is the most common and which is the rerest blood group among these students.
In , you were asked to prepare a frequency distribution table regarding the concentration of sulphur dioxide in the air in parts per million of a certain city for 30 day . Using this table , find the probability of the concentration of sulphur dioxide in the interval 0.12 - 0.16 on any of these days .
The relative humidity (in %) of a certain city for a month of 30 days was as follows : {:(98.1,98.6,99.2,90.3,86.5,95.3,92.9,96.3,94.2,95.1),(89.2,92.3,97.1,93.5,92.7,95.1,97.2,93.3,95.2,97.3),(96.2,92.1,84.9,90.2,95.7,98.3,97.3,96.1,92.1,89):} (i) Construct a grouped frequency distribution table with classes 84-86 ,86-88, etc.
The relative humidity (in %) of a certain city for a month of 30 days was as follows : {:(98.1,98.6,99.2,90.3,86.5,95.3,92.9,96.3,94.2,95.1),(89.2,92.3,97.1,93.5,92.7,95.1,97.2,93.3,95.2,97.3),(96.2,92.1,84.9,90.2,95.7,98.3,97.3,96.1,92.1,89):} (iii) What is the range of this data ?
The relative humidity (in %) of a certain city for a month of 30 days was as follows : {:(98.1,98.6,99.2,90.3,86.5,95.3,92.9,96.3,94.2,95.1),(89.2,92.3,97.1,93.5,92.7,95.1,97.2,93.3,95.2,97.3),(96.2,92.1,84.9,90.2,95.7,98.3,97.3,96.1,92.1,89):} (ii) Which month or season do you think this data is about ?
A contract on construction job specifies a penalty for delay of completionbeyond a certain data as follows: Rs 200 for the first day , Rs250 for the second day, Rs 300 for the third day , etc., the penalty for each succeeding day being Rs50 more than for the preceding day . How much money the contractor has to pay as penalty , if he has delayed the work by 30 days ?