


Similar Questions
Explore conceptually related problems
Recommended Questions
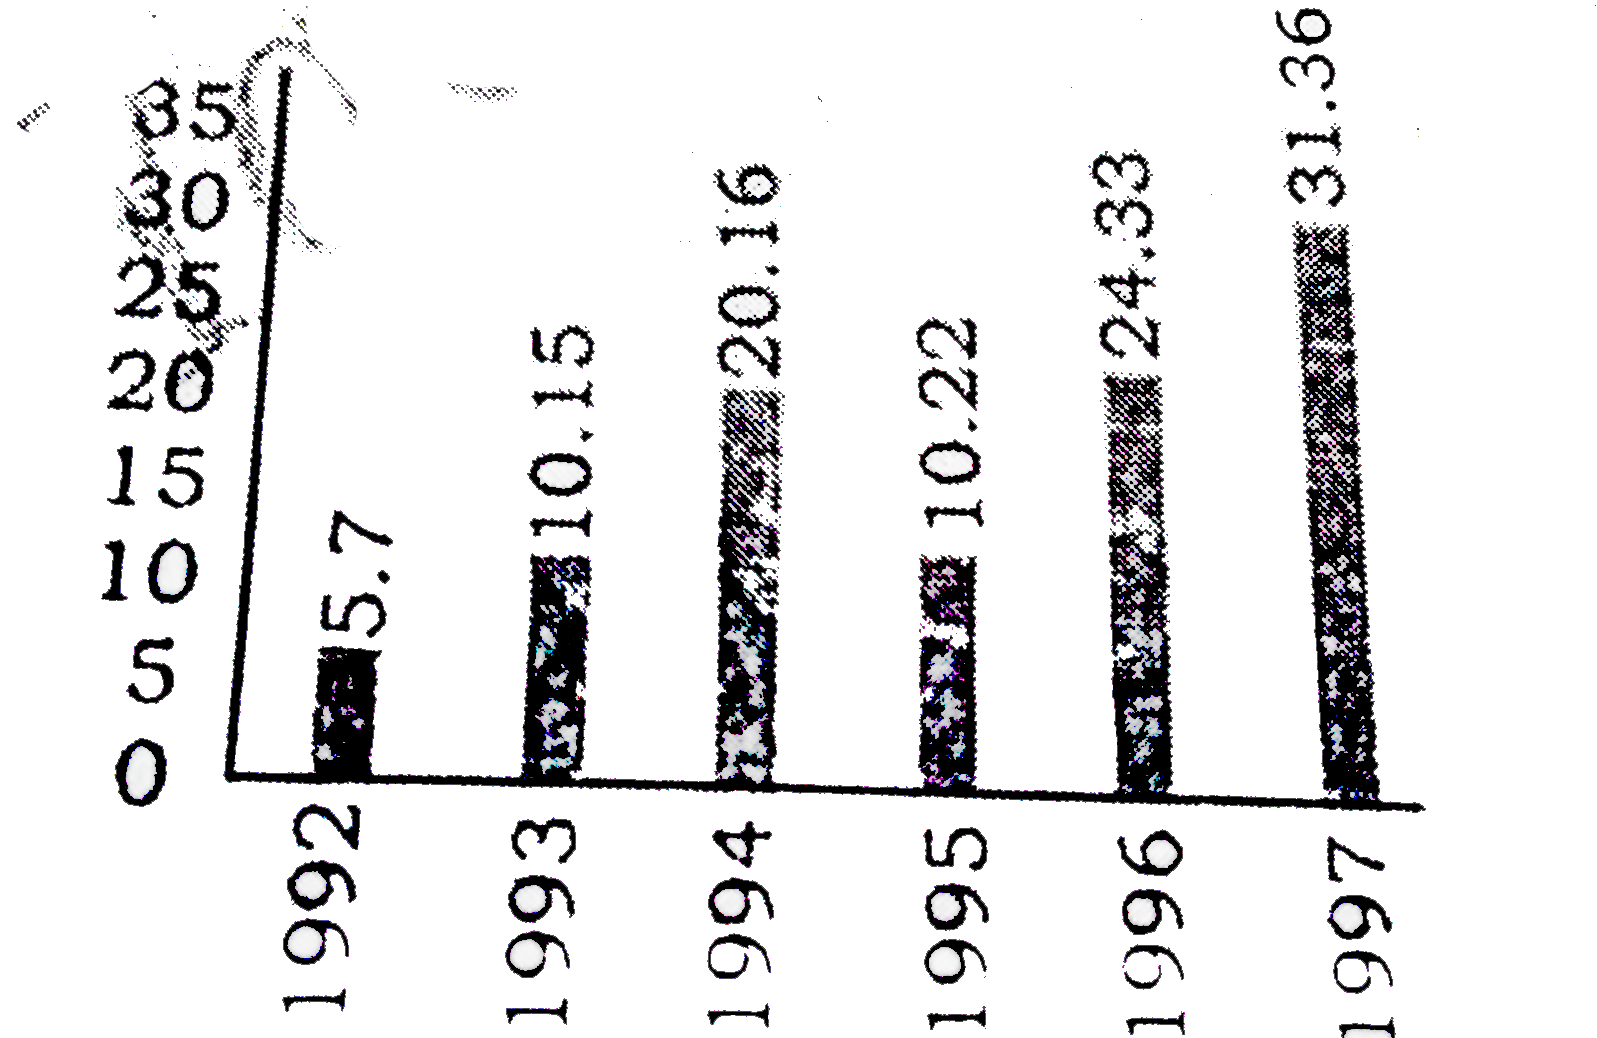
- बार हाफ में समस्त विश्व से भारत में विदेशी प्रत्यक्ष निवेश (एफ़ डी आई )...
Text Solution
|
- Match the following Column A to Column B
Text Solution
|
- निचे दिये गये ग्राफ में दो प्रकार के वाहनों A व B के छ वर्षो के प्रद...
Text Solution
|
- निचे दिये गये ग्राफ में दो प्रकार के वाहनों A व B के छ वर्षो के प्रद...
Text Solution
|
- निचे दिये गये ग्राफ में दो प्रकार के वाहनों A व B के छ वर्षो के प्रद...
Text Solution
|
- निचे दिये गये ग्राफ में दो प्रकार के वाहनों A व B के छ वर्षो के प्रद...
Text Solution
|
- गोला एवं अर्ध गोले का आयतन|समस्त सूत्रों का पुनरीक्षण एक बार में
Text Solution
|
- Study the bar diagram and answer the questions. बार-आरेख का अध्ययन करे...
Text Solution
|
- Study the chart and answer the questions: In which of the given year...
Text Solution
|