


NCERT TAMIL-LAW OF MOTION-EXERCISE (ADDITIONAL EXERCISE)
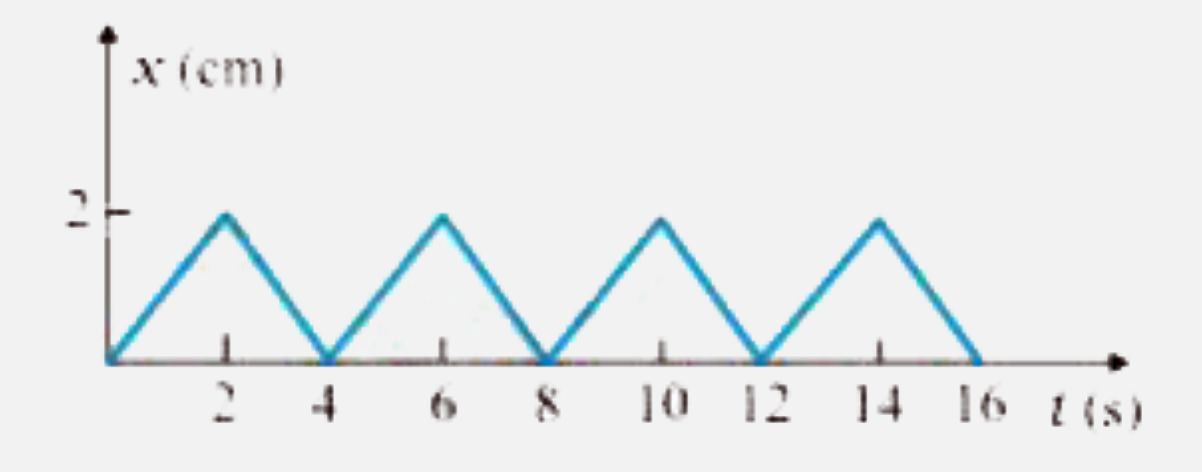
- Figure shows the position-time graph of a body of mass 0.04 kg. Sugg...
Text Solution
|
- Figure shows a man standing stationary with respect to a horizontal c...
Text Solution
|
- A stone of mass m tied to the end of a string revolves in a vertical c...
Text Solution
|
- A helicopter of mass 1000 kg rises with a vertical acceleration of 15 ...
Text Solution
|
- A stream of water flowing horizontally with a speed of 15 ms^(-1) push...
Text Solution
|
- Ten one-rupee coins are put on top of each other on a table. Each coin...
Text Solution
|
- An aircraft executes a horizontal loop at a speed of 720 "kmh"^(-1) wi...
Text Solution
|
- A train rounds an unbanked circular bend of radius 30 m at a speed of ...
Text Solution
|
- A block of mass 25 kg is raised by a 50 kg man in two different ways a...
Text Solution
|
- A monkey of mass 40 kg climbs on a rope. which can stand a maximum ten...
Text Solution
|
- Two bodies A and B of masses 5 kg and 10 kg in contact with each othe...
Text Solution
|
- A block of mass 15 kg is placed on a long trolly . The coefficient of ...
Text Solution
|
- The rear side of a truck is open and a box of 40 kg mass is placed 5 m...
Text Solution
|
- A long plying record revolves with a speed of 33 (1)/(3) "rev min"^(-1...
Text Solution
|
- You may have seen in a circus a motorcyclist driving in vertical loop...
Text Solution
|
- A 70kg man stands in contact against the inner wall of a hollow cylind...
Text Solution
|
- A thin circular wire of radius R rotatites about its vertical diameter...
Text Solution
|