


Similar Questions
Explore conceptually related problems
Recommended Questions
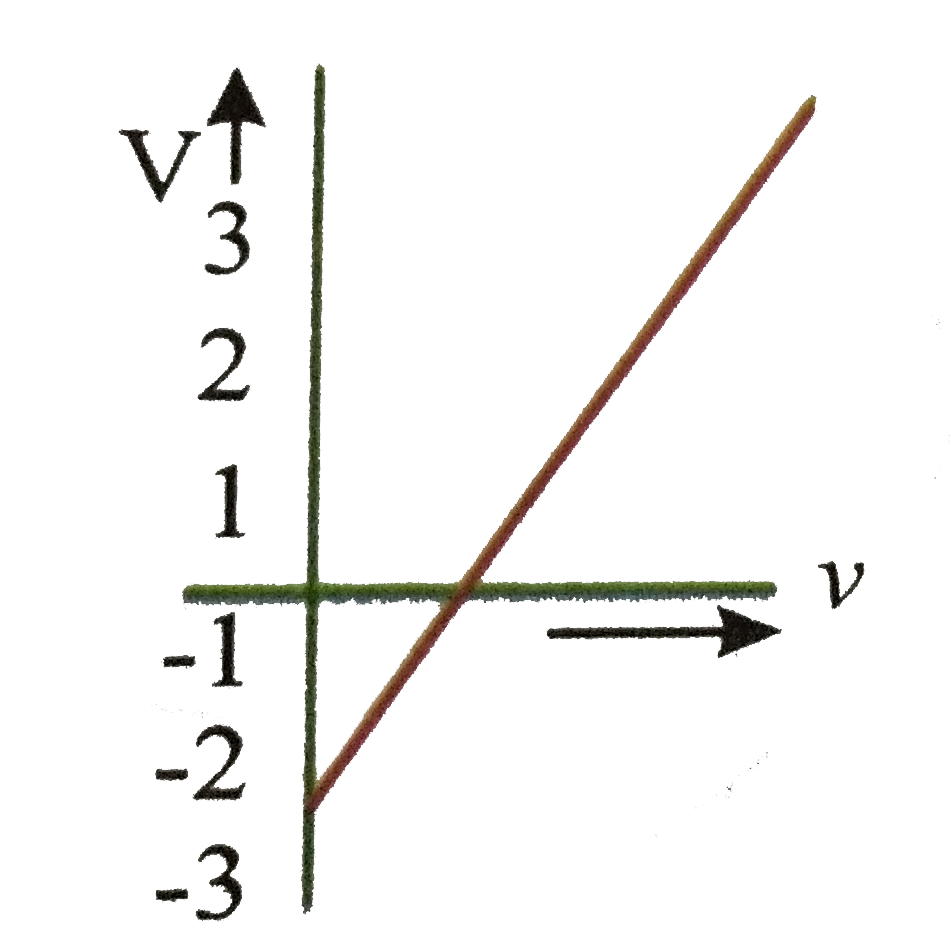
- From the graph shown, the value of work function if the stopping poten...
Text Solution
|
- The stopping potential V for photoelectric emission from a metal surfa...
Text Solution
|
- From the graph shown, the value of work function if the stopping poten...
Text Solution
|
- Which of the following is the graph between the frequency (v) of the i...
Text Solution
|
- In a photoelectric experiment, the graph of frequency v of incident li...
Text Solution
|
- The work function of Cs is 2.14eV.Find (a) threshold frequency for ...
Text Solution
|
- प्रकाश - वैधुत प्रभाव के प्रयोग में आपतित प्रकाश की आवृति (v ) तथा निर...
Text Solution
|
- In photoelectric effect the slope of straight line graph between stopp...
Text Solution
|
- Graph between stopping potential and frequency of light as shown find ...
Text Solution
|