


Similar Questions
Explore conceptually related problems
Recommended Questions
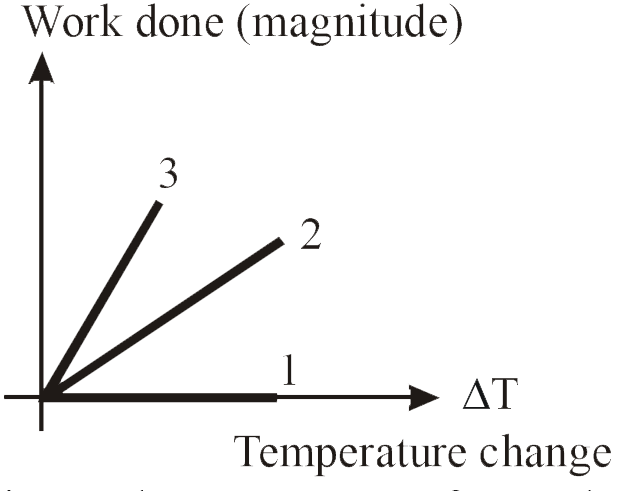
- For an ideal gas graph is shown for three processes. Process 1, 2 and ...
Text Solution
|
- The process on an ideal gas, shown in figure,is
Text Solution
|
- An ideal gas undergoes the cyclic process shown in a graph below :
Text Solution
|
- The indicator diagram for two processes 1 and 2 carrying on an ideal g...
Text Solution
|
- V-T graph of a process of monoatomic ideal gas is shown in figure. ...
Text Solution
|
- V-T graph of a process of monoatomic ideal gas is shown in figure. Hea...
Text Solution
|
- V-T graph of a process of monoatomic ideal gas is shown in figure. Cha...
Text Solution
|
- For an ideal gas graph is shown for three processes. Process 1, 2 and ...
Text Solution
|
- An ideal monatomic gas undergoes a cyclic process ABCA as shown in the...
Text Solution
|