


Similar Questions
Explore conceptually related problems
Recommended Questions
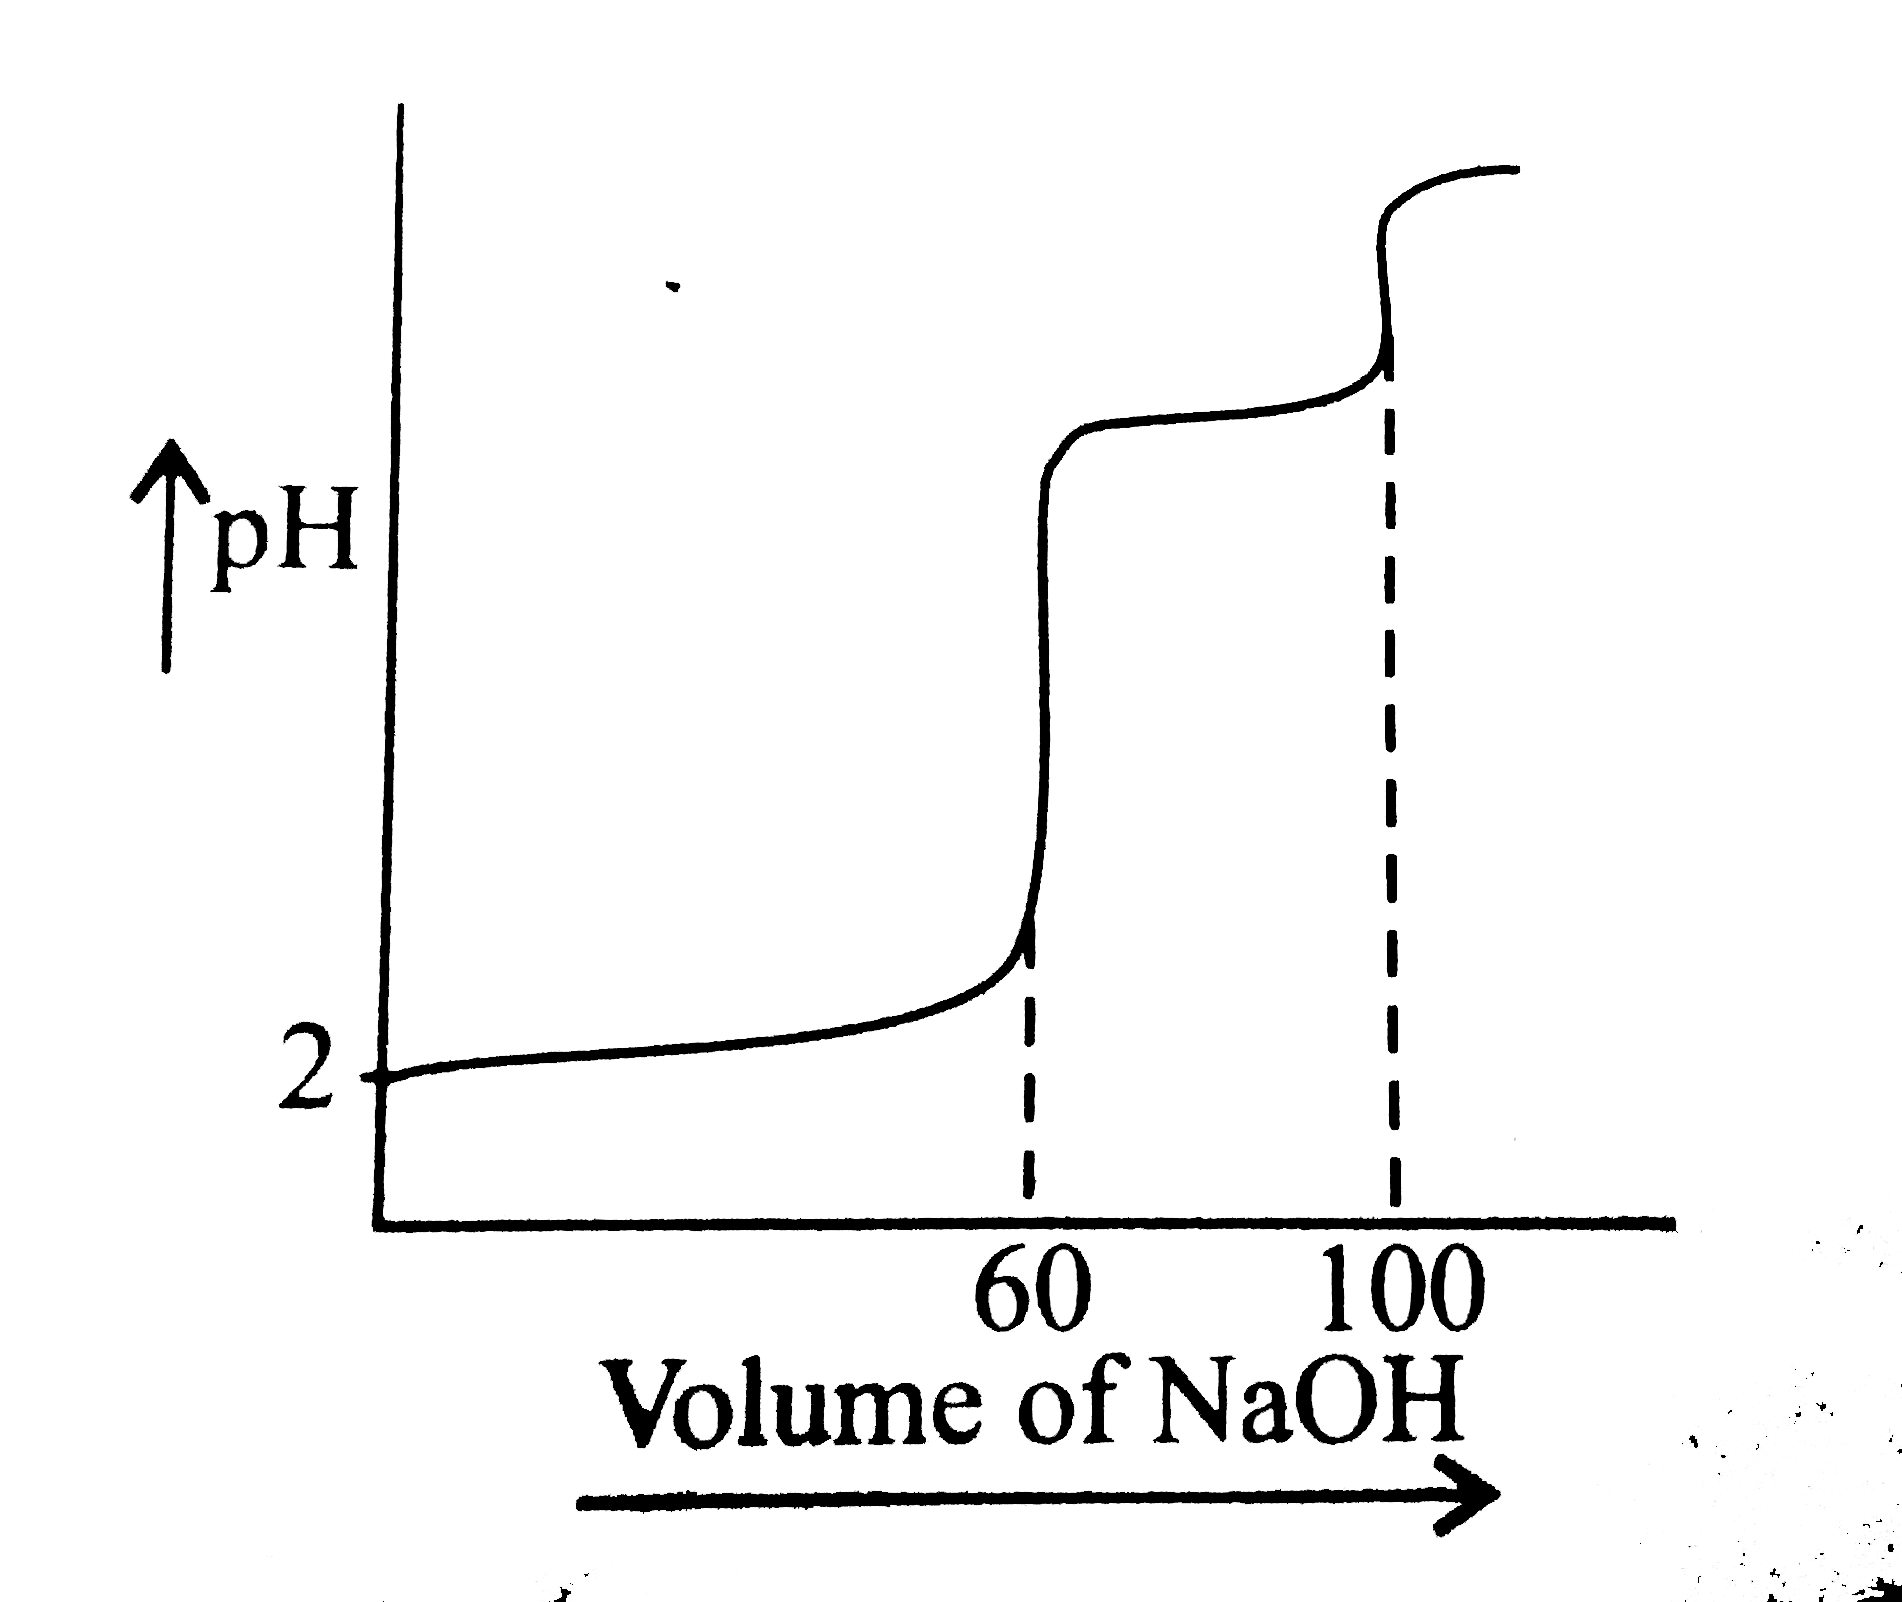
- The following graph represents the titration of pH vs volume
Text Solution
|
- The following graph represents the titration of pH vs volume
Text Solution
|
- Density vs volume graph is shown in the figure. Find corresponding pre...
Text Solution
|
- The graph represents the titration curve for :
Text Solution
|
- Density vs volume graph is shown in the figure . Find corresponding pr...
Text Solution
|
- A graph plotted between log k vs (1)/(T) is represented by
Text Solution
|
- Which one of the following curves represents the graph pH during the t...
Text Solution
|
- which one of the following curves represents the graph of pH dur...
Text Solution
|
- Which of the following plot represents the graph of pH against volume ...
Text Solution
|