


Similar Questions
Explore conceptually related problems
Recommended Questions
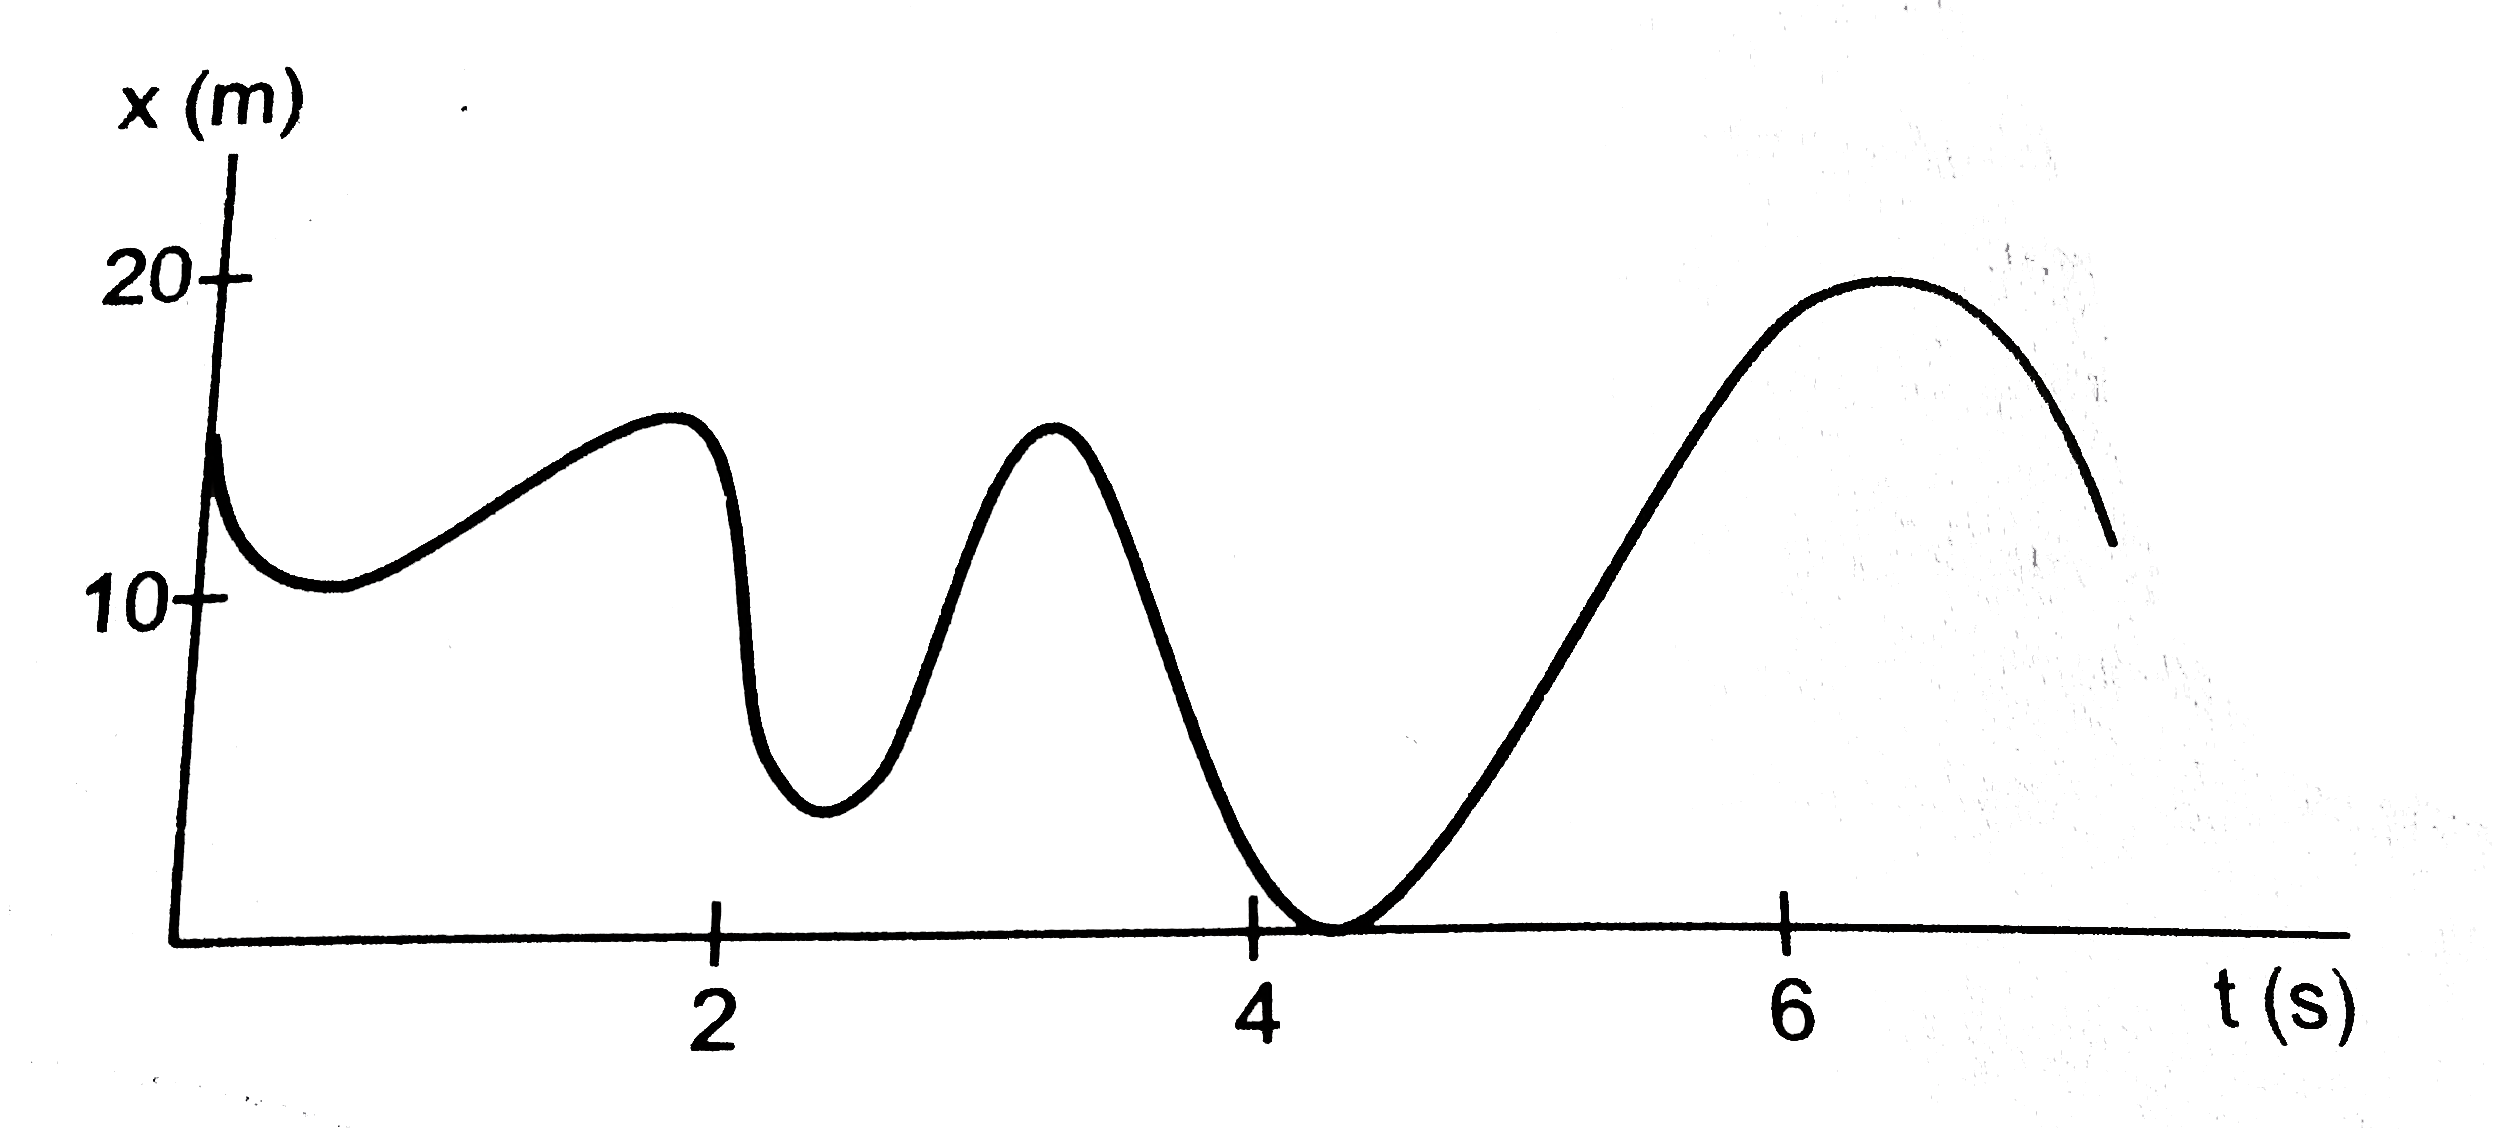
- Figure shows the position of a particle moving on the X-axis as a func...
Text Solution
|
- Figure shows the displacement time graph of a particle moving on the X...
Text Solution
|
- Figure shows the position of a particle moving on the X-axis as a func...
Text Solution
|
- Figure shows the displacement of a particle going along the X-axis as ...
Text Solution
|
- Figure shows the position of a particle moving on the x-axis as a func...
Text Solution
|
- A particle is moving along X-axis under a force such that its position...
Text Solution
|
- Figure shows the position-time graph of a particle moving on the X--ax...
Text Solution
|
- Figure shows the displacement (x)-time (f) graph of a particle moving ...
Text Solution
|
- Figure shows the position of a particle moving on the x - axis as a fu...
Text Solution
|