


Similar Questions
Explore conceptually related problems
Recommended Questions
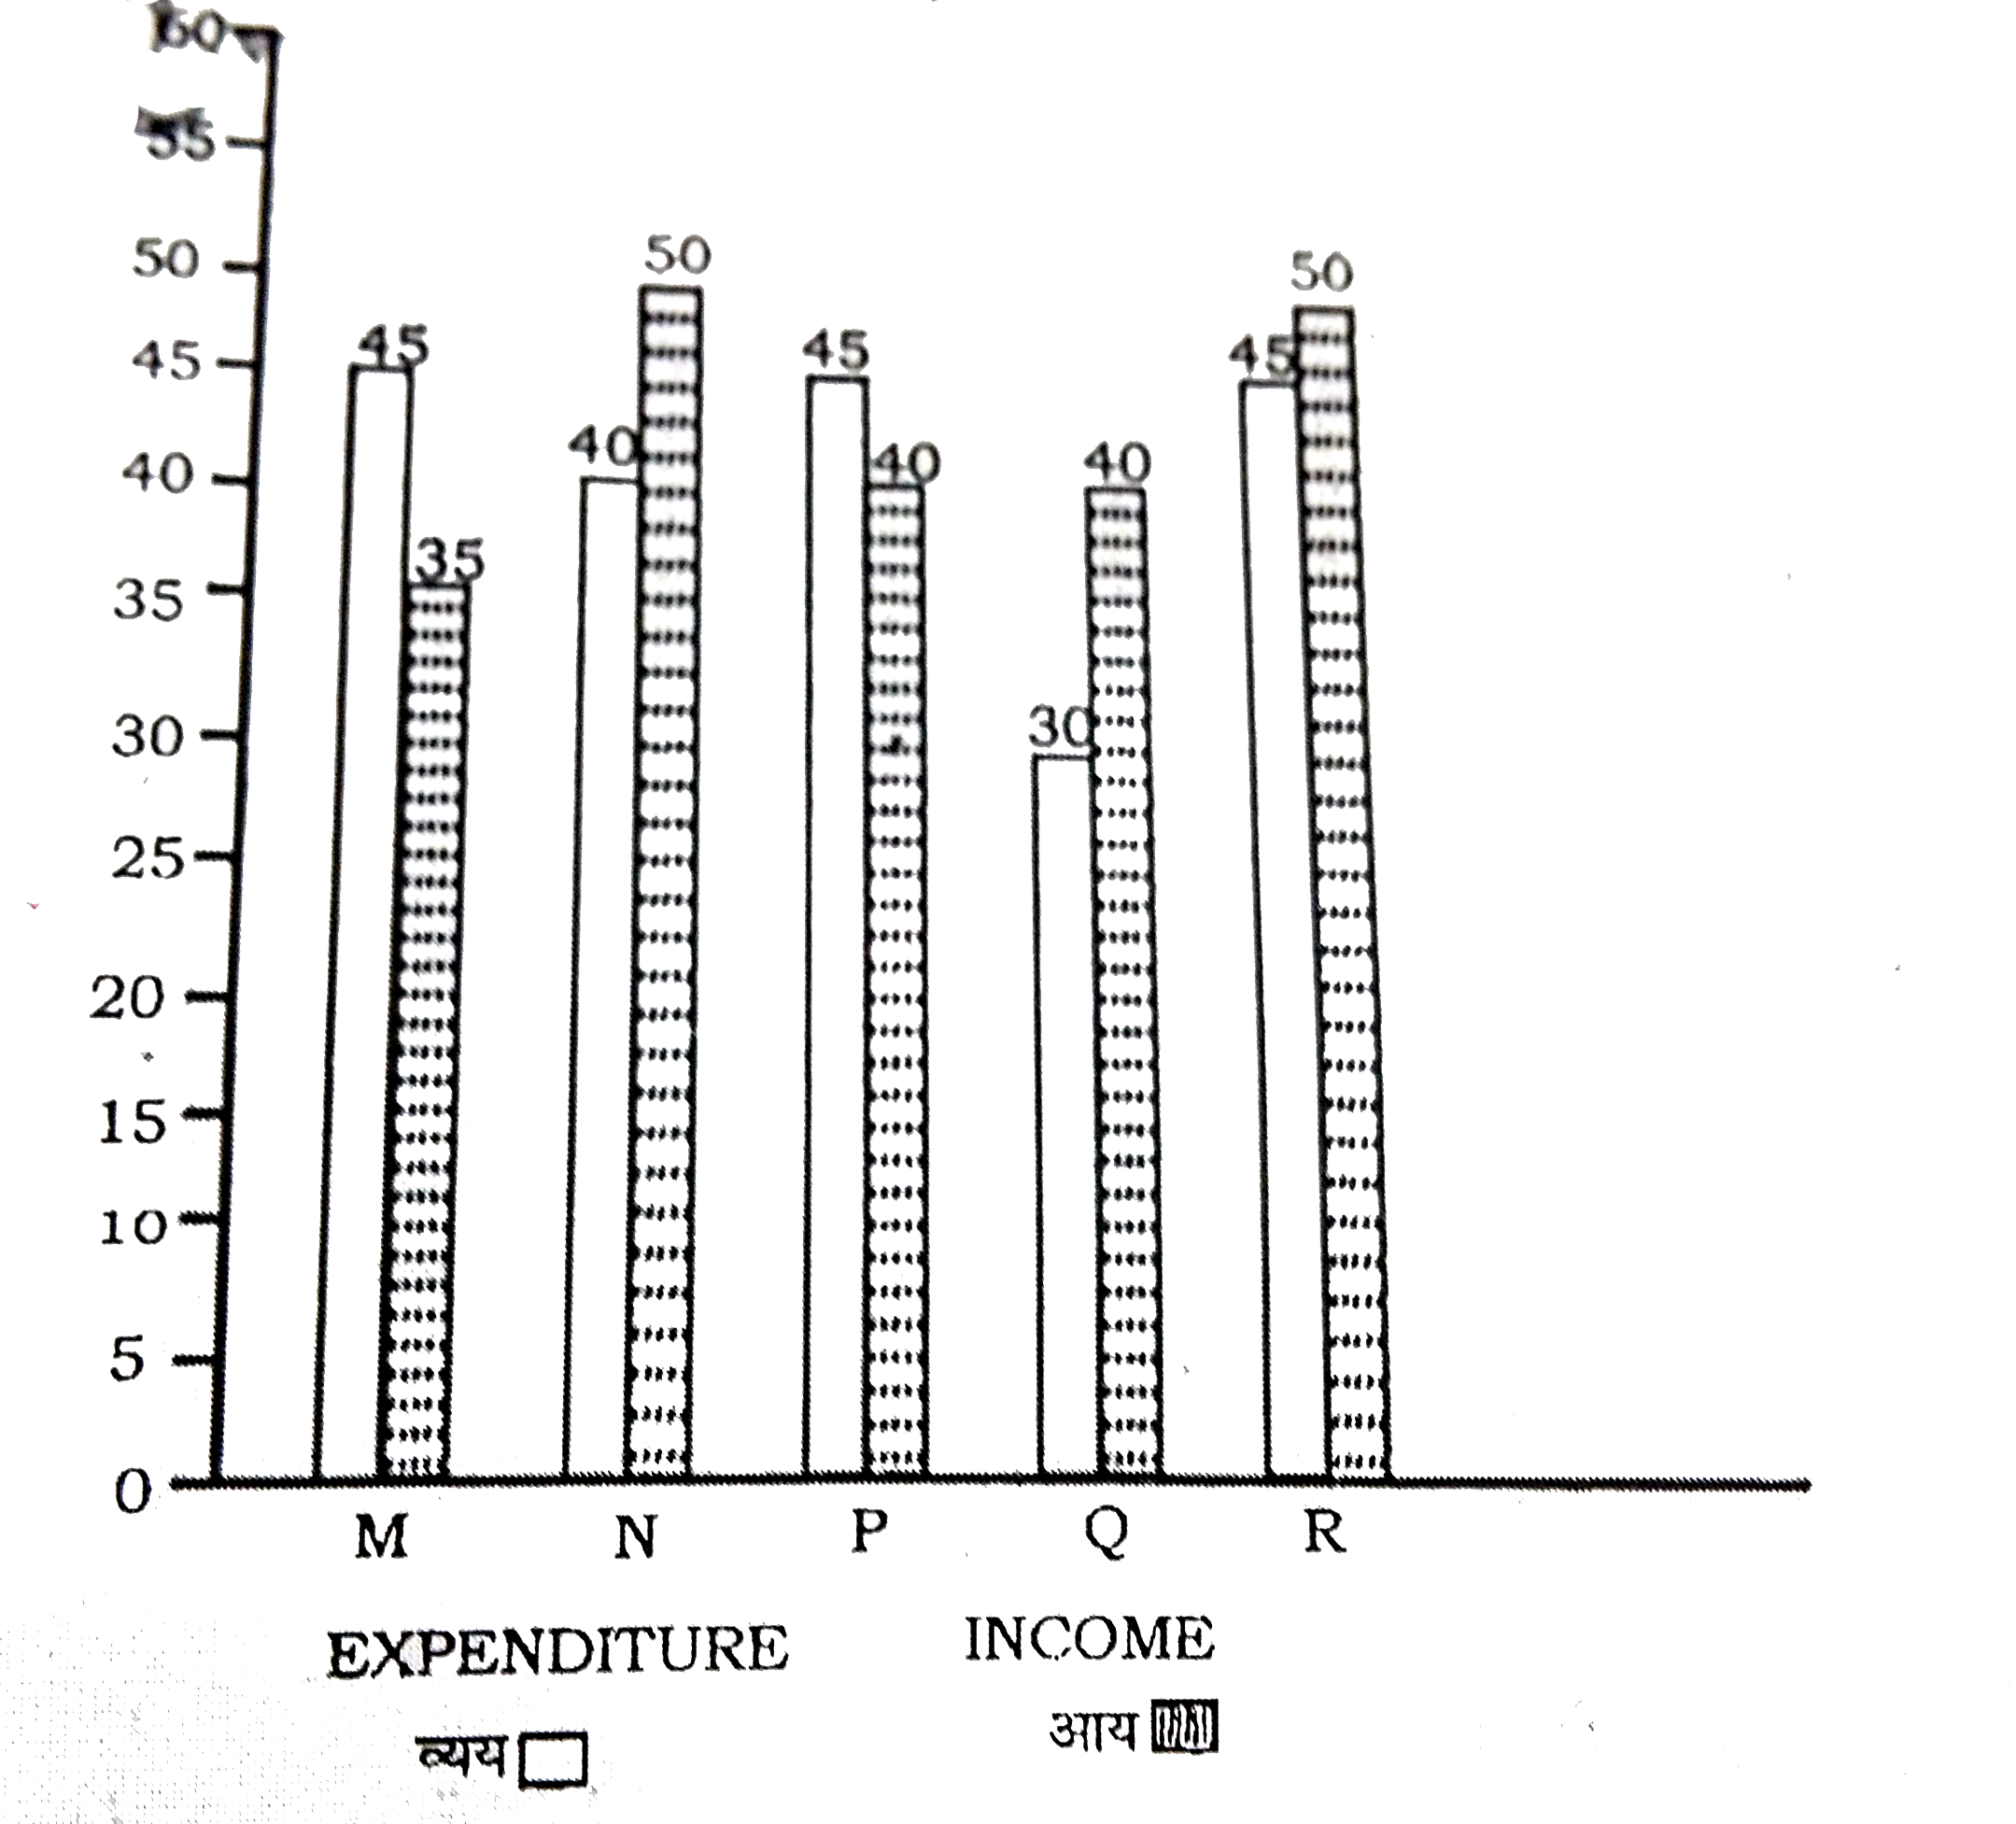
- निर्देश :- बार चार्ट का अध्ययन कीजिये और प्रश्नो के उत्तर दीजिये । ...
Text Solution
|
- The following line diagram represents the yearly sales figure of a com...
Text Solution
|
- The following line diagram represents the yearly sales figure of a com...
Text Solution
|
- The following line diagram represents the yearly sales figure of a com...
Text Solution
|
- The population of a town has increased by 5% at the end of the first y...
Text Solution
|
- Salary of A increased by 8% in the year 2015 as compared to 2014 and d...
Text Solution
|
- The given Bar Graph presents Income and Expenditure (in crores of Rupe...
Text Solution
|
- The given Bar Graph presents the sales of the number of books (in thou...
Text Solution
|
- The given bar graph shows the sale of books (in thousands) in four met...
Text Solution
|