


Similar Questions
Explore conceptually related problems
Recommended Questions
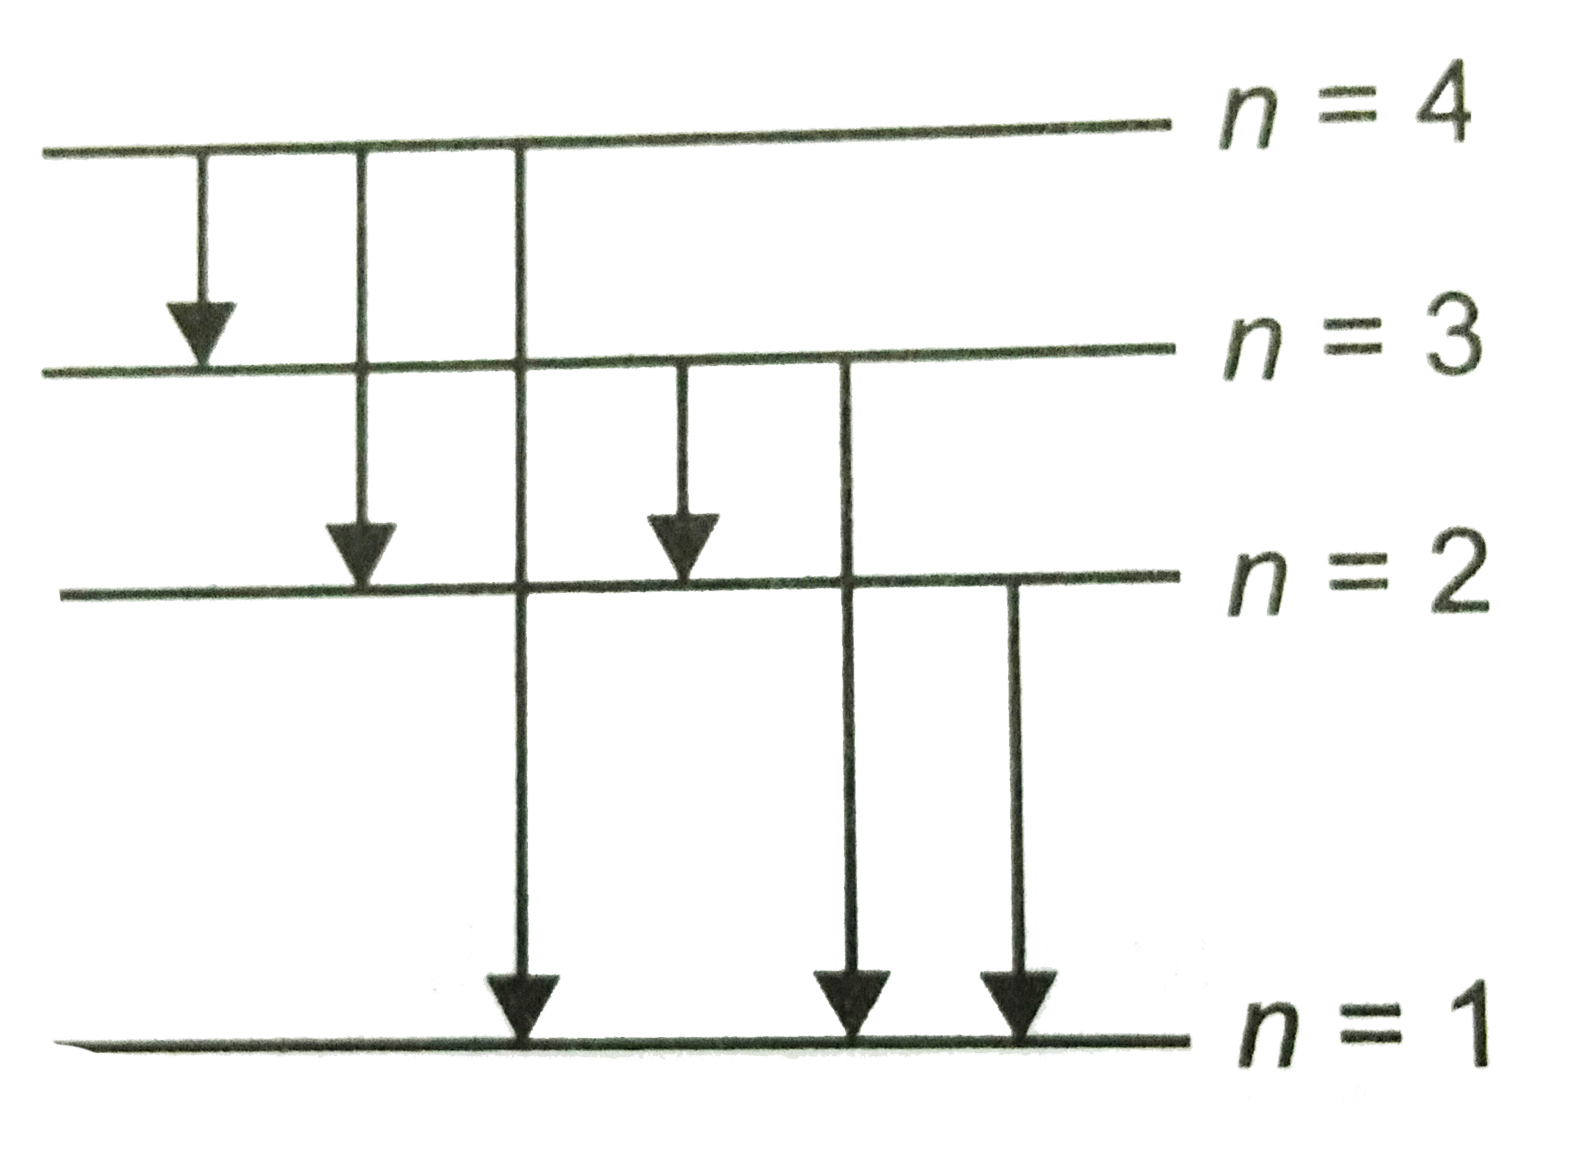
- Fig. shows energy level diagram of hydrogen atom. Find out the transit...
Text Solution
|
- The energy levels of an atom are as shown in figure . Which one of tho...
Text Solution
|
- The energy levels of an atom are shown in fig. Which transition corres...
Text Solution
|
- Fig. shows energy level diagram of hydrogen atom. Find out the transit...
Text Solution
|
- The energy levels of an atom of element X are shown in Fig. 20.2. Whic...
Text Solution
|
- The energy levels of a hypothetical aton are shown below. Which of the...
Text Solution
|
- कौन-सा संक्रमण अधिकतम तरंगदैधर्य के उत्सर्जन के संगत हैं ?
Text Solution
|
- एक परमाणु के ऊर्जा स्तर नीचे दिए चित्र में प्रदर्शित हैं । प्रदर्शित उ...
Text Solution
|
- The energy levels of an atom of element X are shown in the diagram. Wh...
Text Solution
|