


Similar Questions
Explore conceptually related problems
Recommended Questions
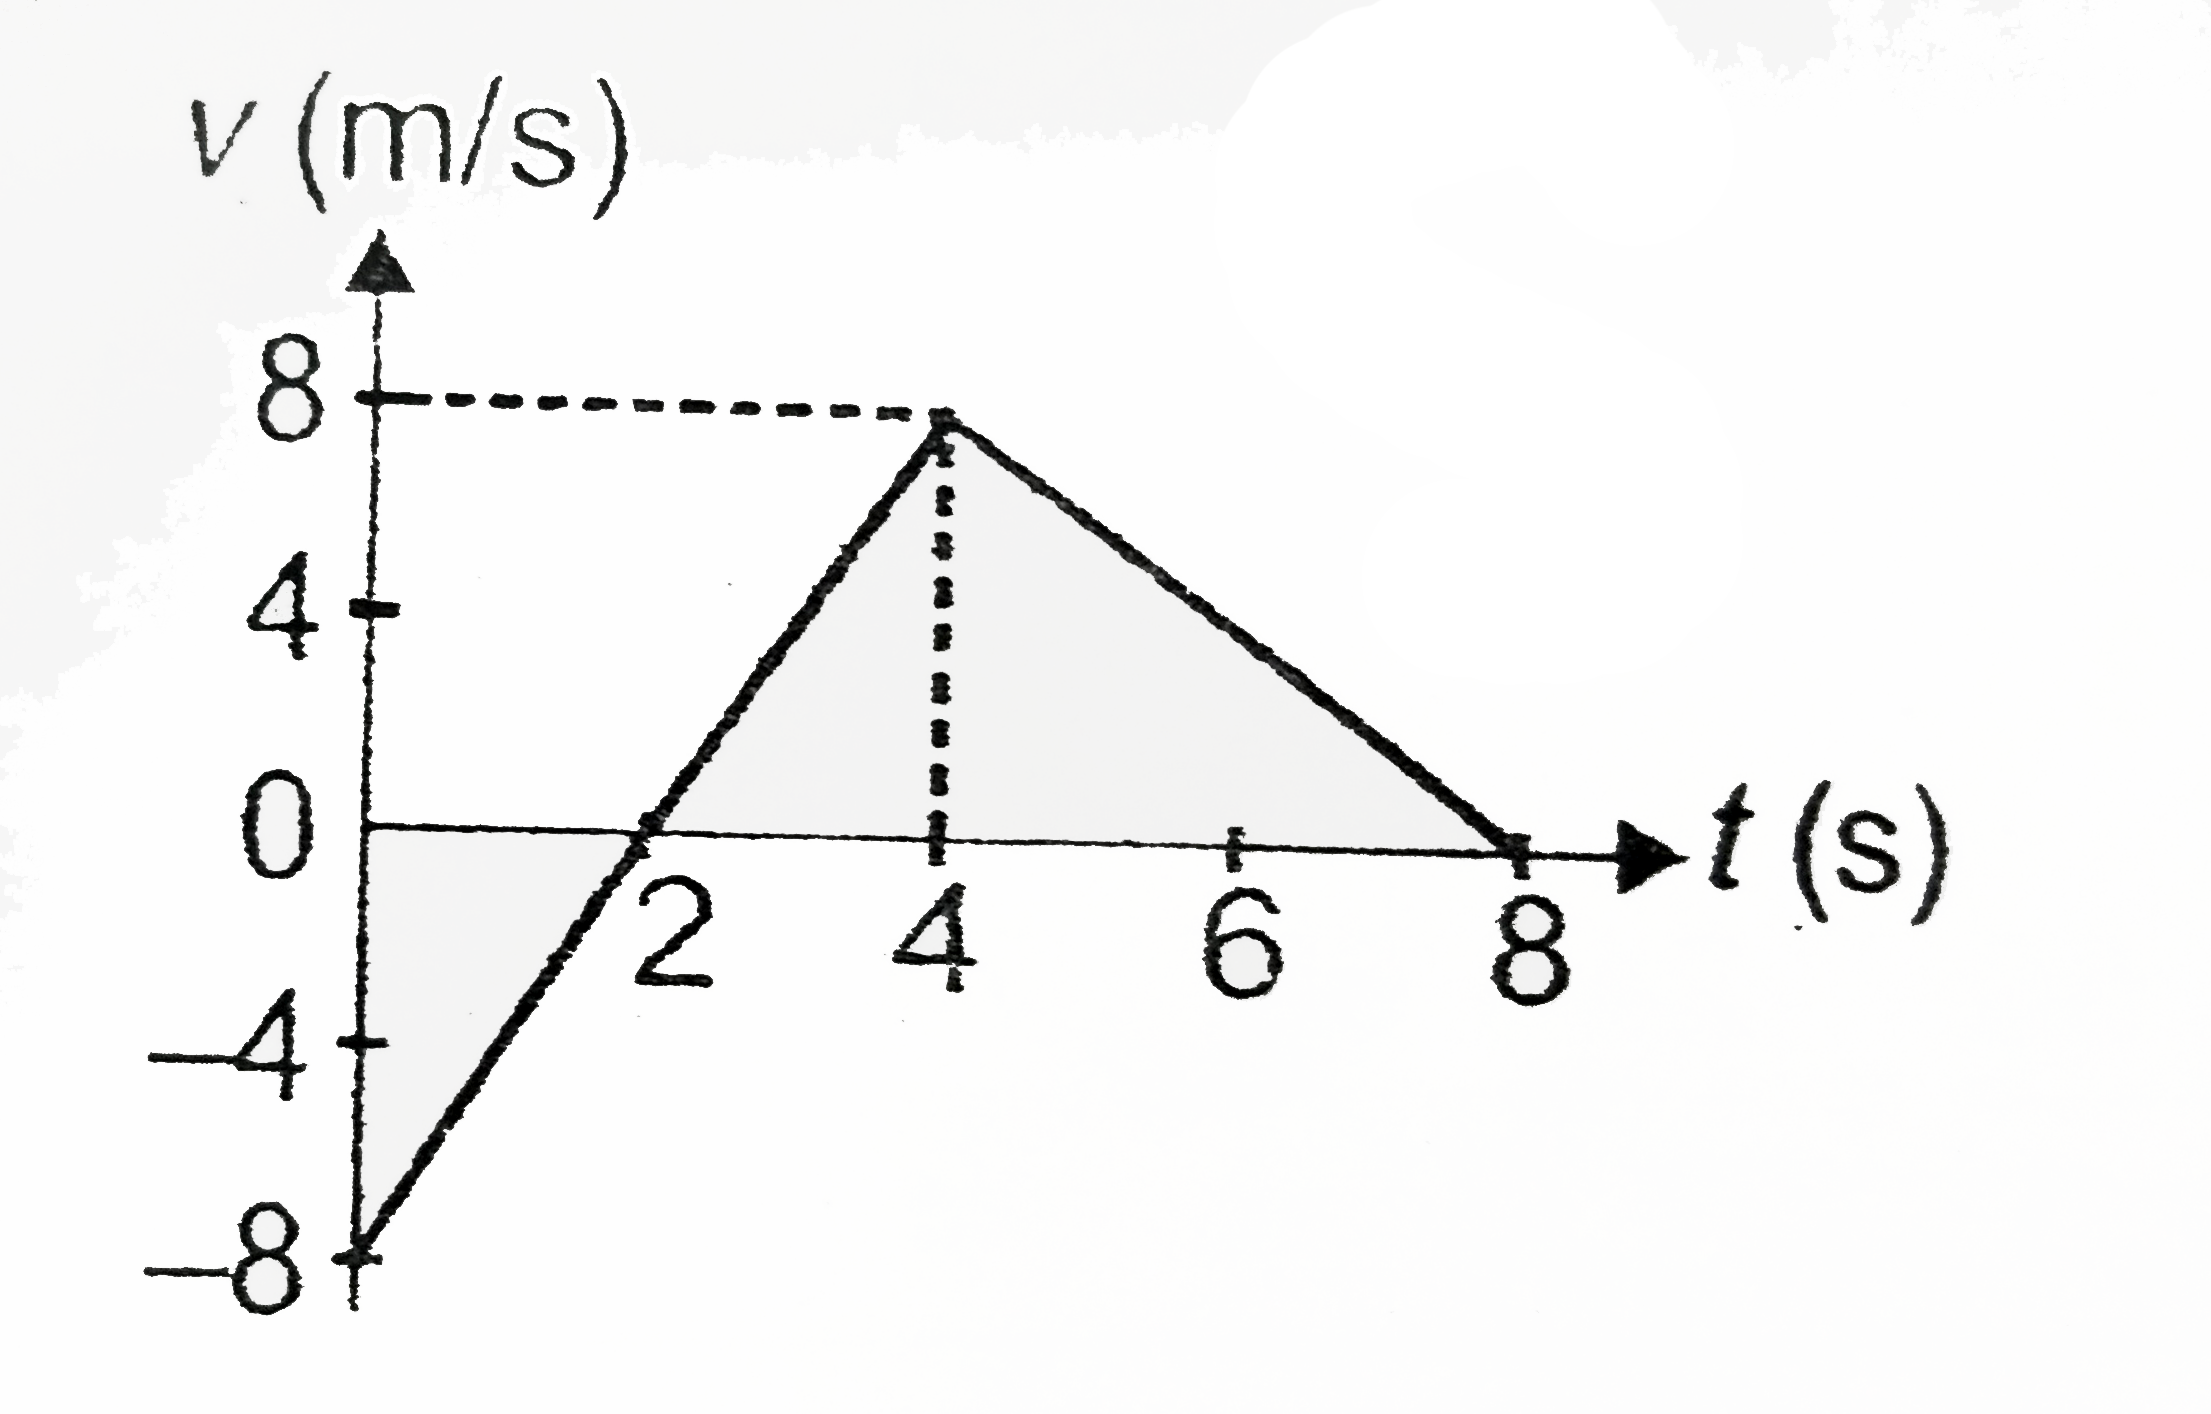
- The v-t graph for a particle moving along x-axis is shown in the figur...
Text Solution
|
- A particle is moving in a circle of radius 4 cm with constant speed of...
Text Solution
|
- Velocity-time graph of a particle moving in a straight line is shown i...
Text Solution
|
- Acceleration-time graph of a particle moving in a straight line is as ...
Text Solution
|
- The displacement of a particla moving in straight line is given by s=t...
Text Solution
|
- The position of a particle moving on the x-axis is given by x=t^(3)+4t...
Text Solution
|
- The position of a particle varies with time according to the relation ...
Text Solution
|
- The v-t graph for a particle moving along x-axis is shown in the figur...
Text Solution
|
- चित्र में x - अक्ष पर चलते हुए एक कण का x - निर्देशांक समय ...
Text Solution
|