


Similar Questions
Explore conceptually related problems
Recommended Questions
- The speed - time graph of a particle moving along a solid curve is sho...
Text Solution
|
- The x-t graph of a particle moving along a straight line is shown in f...
Text Solution
|
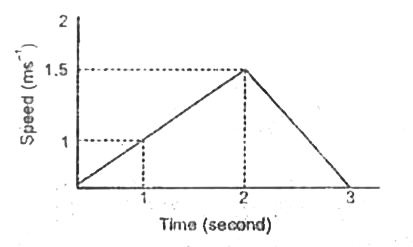
- The speed-time graph of a particle moving along a fixed direction is s...
Text Solution
|
- The x-t graph of particle moving along a straight line is shown in fig...
Text Solution
|
- The x-t graph of particle moving along a straight line is shown in fig...
Text Solution
|
- The position versus time graph of a particle moving along a straight l...
Text Solution
|
- Position-time graph for a particle moving along x- direction is as sho...
Text Solution
|
- The speed-time graph of a particle moving along a fixed direction as s...
Text Solution
|
- A graph of acceleration versus time of a particle starting from rest a...
Text Solution
|