


Similar Questions
Explore conceptually related problems
Recommended Questions
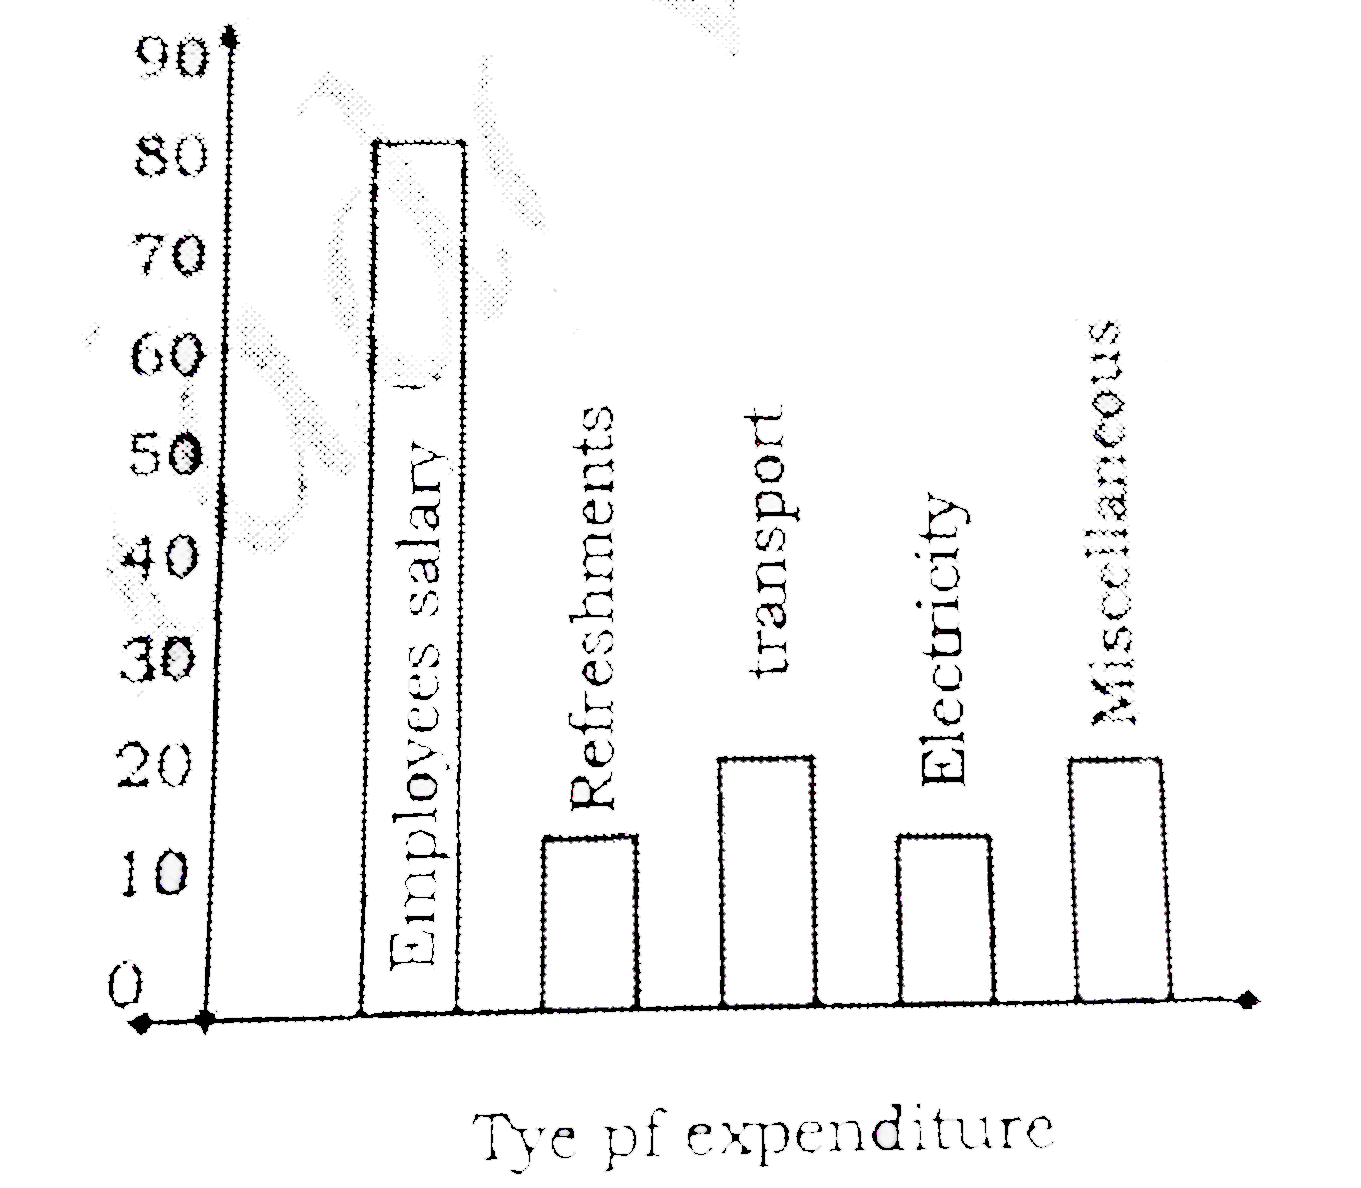
- ग्राफ में किसी कम्पनी के मासिक व्यय को दर्शाया गया है। ग्राफ का अध्ययन...
Text Solution
|
- Determine the point of symmetry of a regular hexagon. <img src="htt...
Text Solution
|
- Match the following Column A to Column B
Text Solution
|
- Match the following Column A to Column B
Text Solution
|
- Match the following Column A to Column B
Text Solution
|
- The inequation represented by the graph given below is : <img src="htt...
Text Solution
|
- The inequation that best describes the graph given below is <img src=...
Text Solution
|
- The inequation that best describes the following graph is <img src="h...
Text Solution
|
- निचे दिये गये ग्राफ में दो प्रकार के वाहनों A व B के छ वर्षो के प्रद...
Text Solution
|