


Similar Questions
Explore conceptually related problems
Recommended Questions
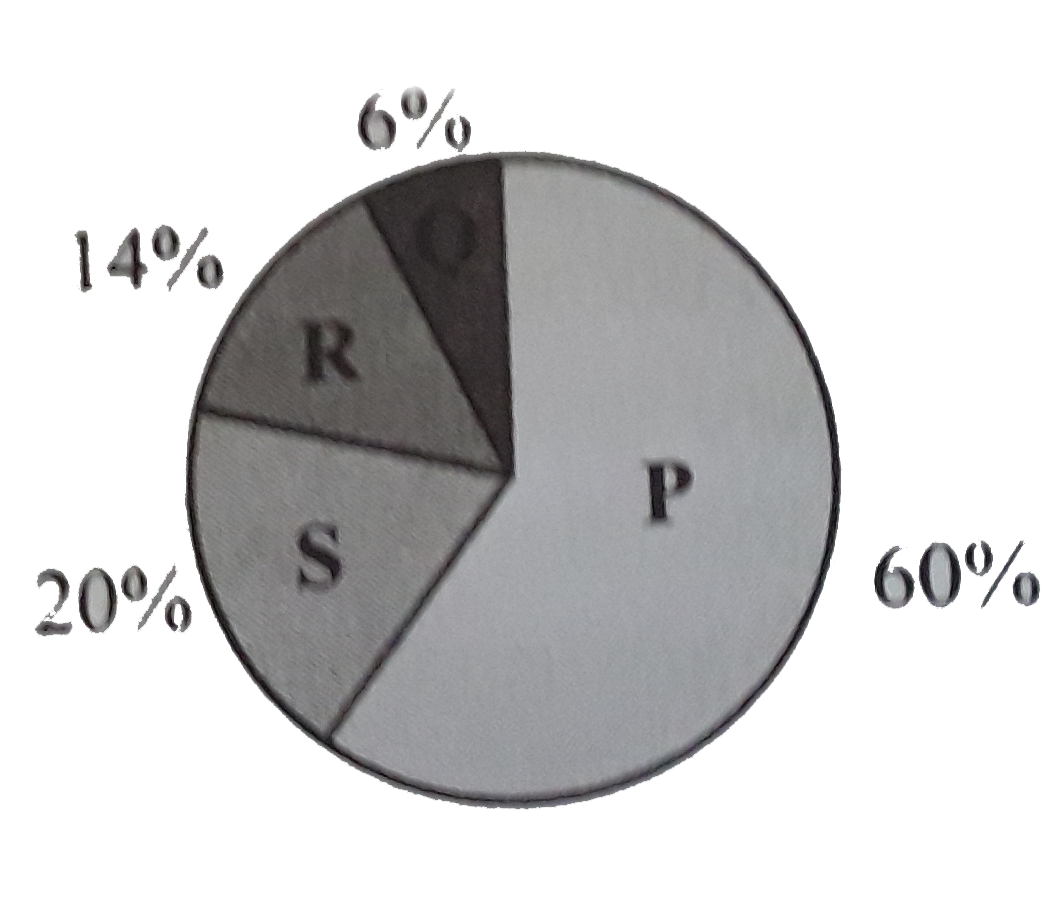
- Given pie-diagram represents the relative contribution of various gree...
Text Solution
|
- Given pie-diagram represents the relative contribution of various gree...
Text Solution
|
- Given pie-diagram represents the relative contribution of various GHGs...
Text Solution
|
- Relative contribution of various green house gases to total global war...
Text Solution
|
- Select the correct option for A, B , C and D given in the figure with ...
Text Solution
|
- The figure is showing relative contribution of various green house gas...
Text Solution
|
- Select the correct option by identifying the relative contribution of ...
Text Solution
|
- Name the various greenhouse gases? Give their percentage contribution ...
Text Solution
|
- Explain relative contribution of various greenhouse gases to total glo...
Text Solution
|