Home
Class 12
PHYSICS
C धारिता वाले अनेक सधारित्र चित्र में दर...

C धारिता वाले अनेक सधारित्र चित्र में दर्शाये अनुसार अनंत संख्या में संयोजित है | बिंदु A और B के मध्य कुल धारिता का मान ज्ञात कीजिये |

Promotional Banner

Similar Questions

Explore conceptually related problems

A sum of Rs. x is divided among A , B and C such that the ratio of shares of A and B is 7: 12 and that of B and C 1s 8: 5. If the difference in the shares of A and C is Rs. 214 , then the value of x is: x रुपये की राशि A , B और C में इस प्रकार विभाजित की जाती है कि A और B के हिस्से का अनुपात 7 : 12 है और B तथा C के हिस्से का अनुपात 8 : 5 है | यदि A और C के हिस्सों में 214 रुपये का अंतर है, तो x का मान ज्ञात करें |

Alloy A contains metal x and y only in the ratio 5 : 2 and alloy B contains these metal in the ratio 3 : 4. Alloy C is prepared by mixing A and B in the ratio 4 : 5. The percentage of x in alloy C is: मिश्र धातु A में धातु x और y केवल 5: 2 के अनुपात में होते हैं और मिश्र धातु B में ये धातु 3: 4 के अनुपात में होते है। मिश्र धातु C में A और B को 4 : 5 में मिश्रण करके तैयार की जाती है। मिश्रधातु C में x का प्रतिशत है:

The ratio of the number of boys in sections A and B of a class is 2 : 3 and the ratio between the total number of boys and girls in sections A and B is 3 : 4. If the number of girls in B is 50% of the number of boys in B, then what will be the ratio between the number of girls in A and B ? एक कक्षा के अनुभाग A और B में लड़कों की संख्या का अनुपात 2:3 है तथा अनुभाग A और B में लड़कों और लड़कियों की कुल संख्या का अनुपात 3:4 है | यदि 8 में लड़कियों की संख्या, B में लड़कों की संख्या की 50% है, तो A और B में लड़कियों की संख्या का अनुपात कितना होगा ?

The given bar graph presents the number of different types of vehicles (in lakhs) exported by a company during 2014 and 2015. दिया गया दंड आरेख एक कंपनी के द्वारा 2014 और 2015 में निर्यात किये गए अलग-अलग प्रकार के वाहनों की संख्या ( लाख में ) को दर्शाता है | What is the ratio of the total number of type A and C vehicles exported in 2014 to the total number of type B and E vehicles exported in 2015? 2014 में निर्यात किये गए A और C प्रकार के वाहनों की कुल संख्या का 2015 में निर्यात किये गए B एवं E प्रकार के वाहनों की कुल संख्या के साथ अनुपात ज्ञात करें |

A,B and C donate 8%,7% and 9%, of their salaries respectively to a charitable trust. The salaries of A and B are the same and the difference between their donations is ₹ 259. The total donation of A and B is ₹1,185 more than that of C. The total donation of A and C is what percentage of the total salaries of A,B and C? (Correct to one decimal place) A, B तथा C अपने वेतन का क्रमशः 8%, 7% तथा 9% भाग एक पुण्यार्थ ट्रस्ट में दान कर देते हैं| & और 8 के वेतन समान हैं तथा उनके दान में 259 रुपये का अंतर है | A और B का कुल दान C के दान से 1,185 रुपये अधिक है | A और C का कुल दान A, B तथा C के कुल वेतन का कितना प्रतिशत है ?

The given Bar Graph presents the number of different types of vehicles exported by a company in 2017 and 2018.What is the ratio of the total number of vehicles exported in 2017 of types B, C and D to that of vehicles exported in 2018 of the types A, D and E? दिया गया दंड आरेख एक कंपनी के द्वारा 2017 और 2018 में निर्यात किये गए अलग-अलग प्रकार के वाहनों की संख्या को दर्शाता है | 2017 में निर्यात किये गए B, C और D प्रकार के वाहनों की कुल संख्या का 2018 में निर्यात किये गए A, D और E प्रकार के वाहनों की संख्या के साथ अनुपात ज्ञात करें |

The table below shows the number of students enrolled in five colleges over the five years (2010 to 2014). यह तालिका पांच कॉलेजों में पांच वर्षों ( 2010 से 2014 ) के दौरान नामांकन लेने वाले छात्रों की संख्या दर्शाती है | What is the ratio of the total students enrolled in colleges A and B in the year 2012 to the total students enrolled in colleges D and E in the year 2013? वर्ष 2012 में कॉलेज A और B में नामांकन लेने वाले कुल छात्रों की संख्या का वर्ष 2013 में कॉलेज D और E में नामांकन लेने वाले कुल छात्रों की संख्या के साथ अनुपात ज्ञात करें|

The given table represents the number of engineers recruited by four companies A,B,C and D over the years. Study the table carefully and answer the questions that follows: The ratio of the total number of engineers recruited by companies A and B in 2015 and 2018 to the total number of engineers recruited by C and D in 2014 and 2018 is: दी गयी तालिका चार कंपनियों A, B, C और D के द्वारा इन वर्षों के दौरान भर्ती किये गए इंजीनियरों की संख्या दर्शाती है | इस तालिका का ध्यानपूर्वक अध्ययन करें तथा इसके बाद पूछे गए प्रश्न का उत्तर दें | कंपनी A और B के द्वारा 2015 और 2018 में भर्ती किये गए इंजीनियरों की कुल संख्या एवं C तथा D के द्वारा 2014 और 2018 में भर्ती किये गए इंजीनियरों की कुल संख्या के बीच अनुपात ज्ञात करें |

Recommended Questions
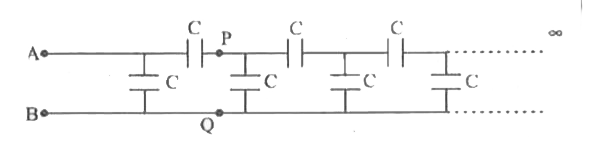
  1. C धारिता वाले अनेक सधारित्र चित्र में दर्शाये अनुसार अनंत संख्या में स...

    Text Solution

    |

  2. दी गई आकृति में बिंदु B ,C तथा D से गुजरने वाले वृत्त के बिंदु B त...

    Text Solution

    |

  3. किसी त्रिभुज ABC में A (a, 0) और B (-a, 0) बिंदु है । शीर्ष C इस...

    Text Solution

    |

  4. चित्र में दिया गया वृत्त चार्ट मई -जून 2013 के दौरान वाहनों का केन्...

    Text Solution

    |

  5. चित्र में दिया गया वृत्त चार्ट मई -जून 2013 के दौरान वाहनों का केन्...

    Text Solution

    |

  6. निम्नलिखित में से कौन-सी संख्या (2)/(7) और (9)/(7) के मध्य में नहीं है...

    Text Solution

    |

  7. किस अनुपात में बिंदु (-2/5,a) बिंदुओं (-4,3) और (2,8) को विभाजित करता ...

    Text Solution

    |

  8. धारिता |आयतन एवं धारिता में अन्तर

    Text Solution

    |

  9. Recap|चालक की धारिता |गोलीय चालक की धारिता |धारिता को प्रभावित करने वा...

    Text Solution

    |