


Similar Questions
Explore conceptually related problems
Recommended Questions
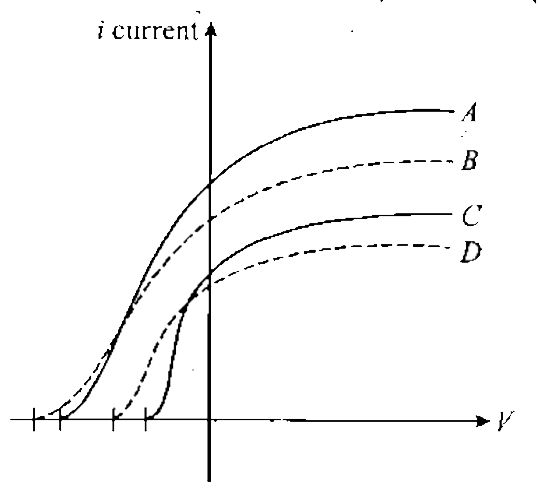
- Thefigure shows the results of an experiment involving photoelectric e...
Text Solution
|
- A light beam containing a number of wavelengths is used in an photoele...
Text Solution
|
- Plot a graph showing the variation of photoelectric current with anode...
Text Solution
|
- The graph is showing the photocurrent with the applied voltage of a ph...
Text Solution
|
- Thefigure shows the results of an experiment involving photoelectric e...
Text Solution
|
- What is photoelectric effect? State the result of photoelectric effect...
Text Solution
|
- Figure shows the results of an experiment involving photoelectric effe...
Text Solution
|
- Figure shows a results of an experiment inolving photoelectric effect....
Text Solution
|
- The graph shows the variation of photocurrent with the applied voltage...
Text Solution
|