Home
Class 6
MATHS
Look at the bar graph given below: S...

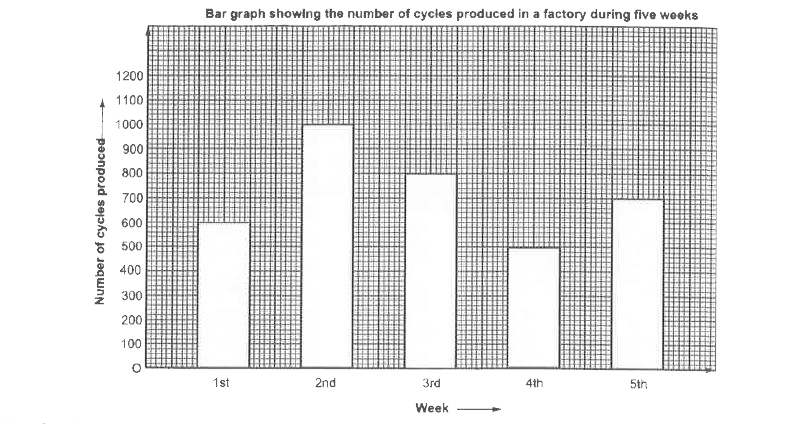
Look at the bar graph given below:

Study the bar graph carefully and answer the question given below:
In which week was the production maximum ?
What is the average production during these five weeks ?
How many cycles were produced in the first 3 weeks ?

Promotional Banner

Similar Questions

Explore conceptually related problems

Observe the bar graph given below : Read the bar graph carefully and answer the following questions : On which day of the week was the sale maximum?

Read the bar graph given below : In which year the production was minimum?

Observe the bar graph given below : Read the bar graph carefully and answer the following questions : What was the total sale during the week?

Study the following graph and answer the questions given below it. In how many of the given years was the production of salt more than the average production of the given years?

After reading the bar graph given below answer the following questions In which year was the productions maximum?

Study the following graph carefully and answer the questions given below In which of the following years, was the percentage production of B type to C type the maximum?

Study the following graph and answer these questions given below:- Tea in India (in million kg.) What was approximately the average production during the period?

Study the bar chart and answer the question based on it. In how many of the given years was the production of fertilizers less than the average production of the given years?