Home
Class 14
MATHS
बार हाफ में समस्त विश्व से भारत में विदे...

बार हाफ में समस्त विश्व से भारत में विदेशी प्रत्यक्ष निवेश (एफ़ डी आई ) की प्रवृत्ति को दर्शाया गया है। बार ग्राफ का ध्यानपूर्वक अध्ययन कीजिये और प्रशनो का उतर दीजिये ?

सभी वर्ष के औसत निवेश के साथ 1997 में किये गए निवेश का अनुपात क्या है ?

Promotional Banner

Similar Questions

Explore conceptually related problems

Study the Bar diagram carefully and answer the question. The Bar diagram shows the trends of foreign direct investment (FDI) into India from all over the World Gin Rs. crores) The ratio of investment in 1997 to the average investment बार ग्राफ में समस्त विश्व से भारत में विदेशी प्रत्यक्ष निवेश (एफ डी आई) की प्रवृत्ति को दर्शाया गया है। बार ग्राफ का ध्यानपूर्वक अध्ययन कीजिए और प्रश्नों का उत्तर दीजिए। वर्ष 1992 और 1997 में किए गए निवेश का अनुपात क्या है।

Study the Bar diagram carefully and answer the question. The Bar diagram shows the trends of foreign direct investment (FDI) into India from all over the World Gin Rs. crores) The sum of FDI of 1992 and 1993 is बार ग्राफ में समस्त विश्व से भारत में विदेशी प्रत्यक्ष निवेश (एफ डी आई) की प्रवृत्ति को दर्शाया गया है। बार ग्राफ का ध्यानपूर्वक अध्ययन कीजिए और प्रश्नों का उत्तर दीजिए। वर्ष 1992 और 1999 में विदेशी प्रत्यक्ष निवेश का कुल योग कितना है ?

Study the Bar diagram carefully and answer the question. The Bar diagram shows the trends of foreign direct investment (FDI) into India from all over the World Gin Rs. crores) The year which exhibited the 2nd highest growth percentage in FDI in India over the period shown is बार ग्राफ में समस्त विश्व से भारत में विदेशी प्रत्यक्ष निवेश (एफ डी आई) की प्रवृत्ति को दर्शाया गया है। बार ग्राफ का ध्यानपूर्वक अध्ययन कीजिए और प्रश्नों का उत्तर दीजिए। दर्शायी गयी अवधि में भारत में किस वर्ष सर्वाधिक विदेशी प्रत्यक्ष निवेश किया गया ?

The distribution of fruit consumption in a sample of 73 seventeen-year-old girls is given in the graph below. Study the graph and answer the questions : What percent of these girls ate six or more servings per day? निम्नलिखित ग्राफ में 72 सत्रह - वर्षीय लड़कियों के सैम्पल में फलों की खपत (उपभोग) के विवरण को दर्शाया गया है। ग्राफ का अध्ययन कीजिए और प्रश्नों के आधार पर उत्तर दीजिए: प्रति दिन छह या अधिक आपूर्ति किए गए फलों को खाने वाली इन लड़कियों का प्रतिशत क्या था?

The graph shows the monthly expenditure of a company (unit = 10 lakhs). Study the graph and answer the questions : The ratio between transport and employee salary on monthly basis is ग्राफ में किसी कम्पनी के मासिक व्यय को दर्शाया गया है। ग्राफ का अध्ययन कीजिए और निम्नलिखित प्रश्नों के उत्तर दीजिए। मासिक आधार पर परिवहन और कर्मचारियों के वेतन के बीच अनुपात कितना है ?

The pie-chart provided below gives the distribution of land (in a village) under various food crops. Study the pie-chart carefully and answer the questions. नीचे दिए गए वृत्तारेखा में विभिन खाद्य फसलों के ( एक गाँव में ) भूमि का वितरण दिखाया गया हैं। वृत्तारेखा का अध्ययन कीजिए और प्रश्नों के उत्तर दीजिए। The ratio of the land used for rice and barley is चावल और जौ के उत्पादन के लिए प्रयुक्त भूमि का अनुपात है-

The following line diagram represents the yearly sales figure of a company in the years 2001-2010. Examine the diagram and answer the question. निम्नलिखित रेखा आरेख किसी कंपनी की वर्ष 2007-2010 के दौरान वार्षिक बिक्री के आंकड़ों को दर्शाता है। आरेख का अध्ययन करें और नीचे दिए गए प्रश्नों के उत्तर दें- The ratio of sales in 2002 to that in 2007 is वर्ष 2002 में बिक्री का वर्ष 2007 में बिक्री के साथ अनुपात है-

Study the following graph which shows income and expenditure of a company over the years and answer the questions. Ratio of total income to total expenditure of the company over the years is. निम्नलिखित चार्ट का अध्ययन कीजिए जिसमें कंपनी की कुछ वर्षों की आय एवं उसके व्यय को दर्शाया गया है और प्रश्नों के उत्तर दीजिए : दिए गए वर्षों में कंपनी की कुल आय और कुल व्यय का अनुपात क्या रहा?

Recommended Questions
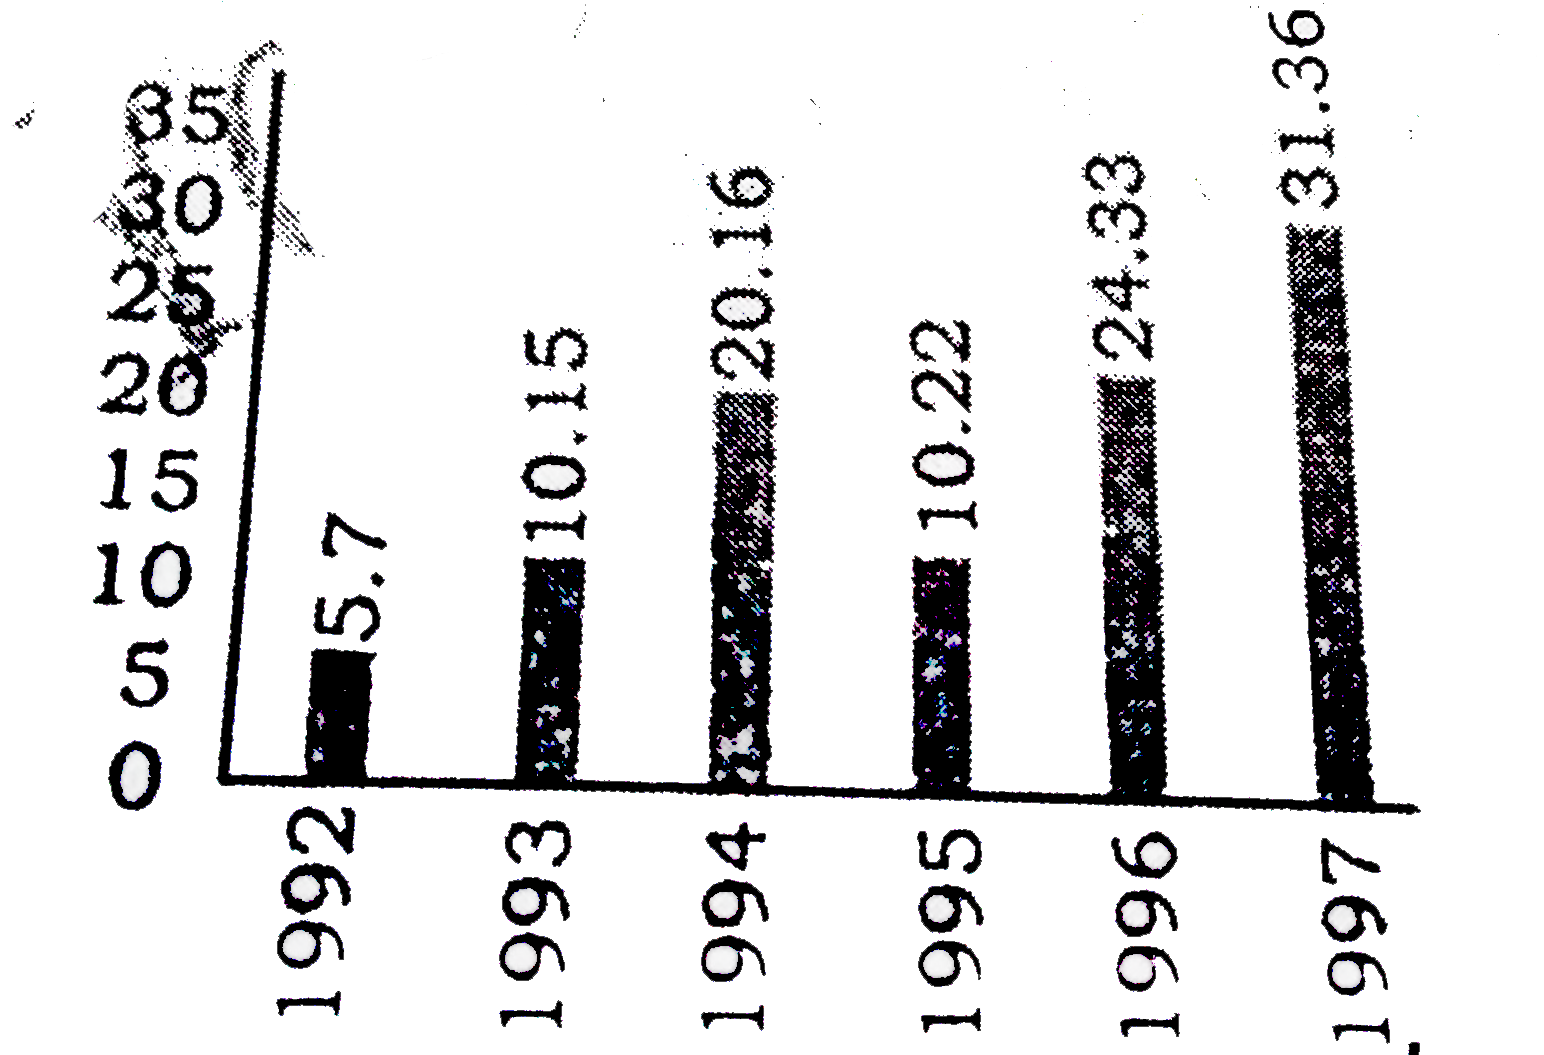
  1. बार हाफ में समस्त विश्व से भारत में विदेशी प्रत्यक्ष निवेश (एफ़ डी आई )...

    Text Solution

    |

  2. Match the following Column A to Column B

    Text Solution

    |

  3. निचे दिये गये ग्राफ में दो प्रकार के वाहनों A व B के छ वर्षो के प्रद...

    Text Solution

    |

  4. निचे दिये गये ग्राफ में दो प्रकार के वाहनों A व B के छ वर्षो के प्रद...

    Text Solution

    |

  5. निचे दिये गये ग्राफ में दो प्रकार के वाहनों A व B के छ वर्षो के प्रद...

    Text Solution

    |

  6. निचे दिये गये ग्राफ में दो प्रकार के वाहनों A व B के छ वर्षो के प्रद...

    Text Solution

    |

  7. निचे दिये गये ग्राफ में दो प्रकार के वाहनों A व B के छ वर्षो के प्रद...

    Text Solution

    |

  8. निचे दिये गये ग्राफ में दो प्रकार के वाहनों A व B के छ वर्षो के प्रद...

    Text Solution

    |

  9. निचे दिये गये ग्राफ में दो प्रकार के वाहनों A व B के छ वर्षो के प्रद...

    Text Solution

    |