A
B
C
D
Text Solution
Verified by Experts
The correct Answer is:


Topper's Solved these Questions
Similar Questions
Explore conceptually related problems
NDA PREVIOUS YEARS-Mechanics-Physics
- A body is thrown vertically upwards and then falls back on the ground....
Text Solution
|
- Which one of the foilowing pairs does not have the same dimension?
Text Solution
|
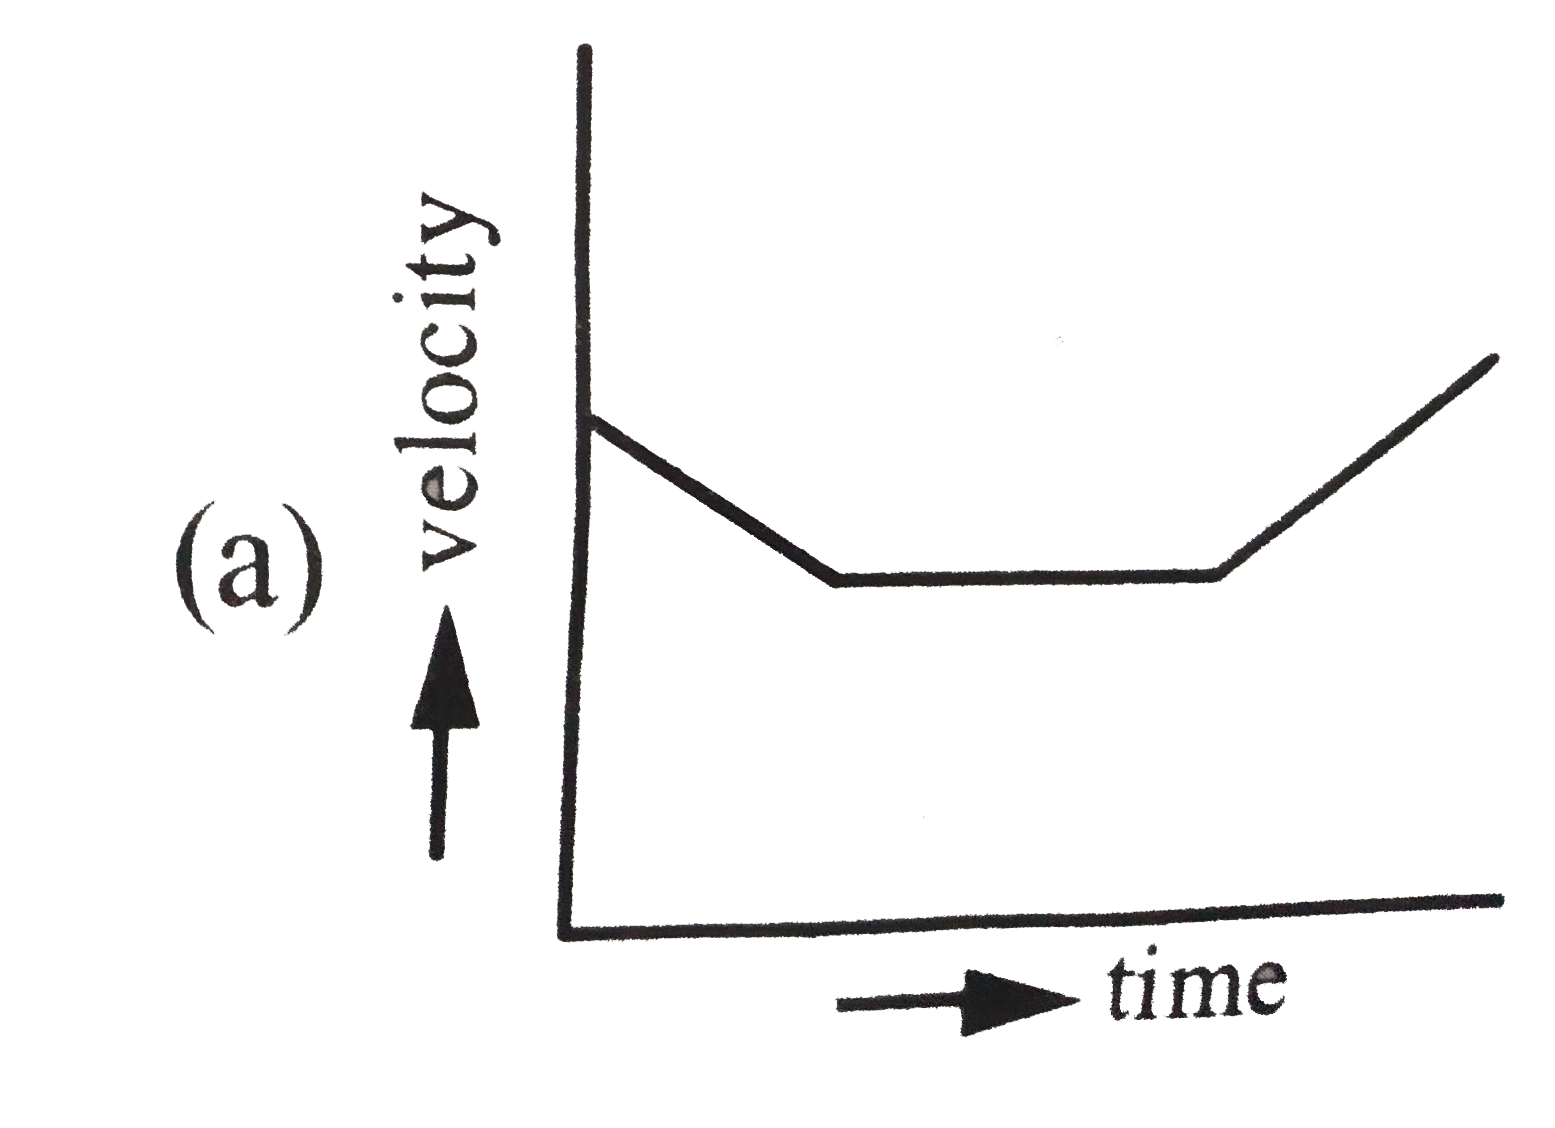
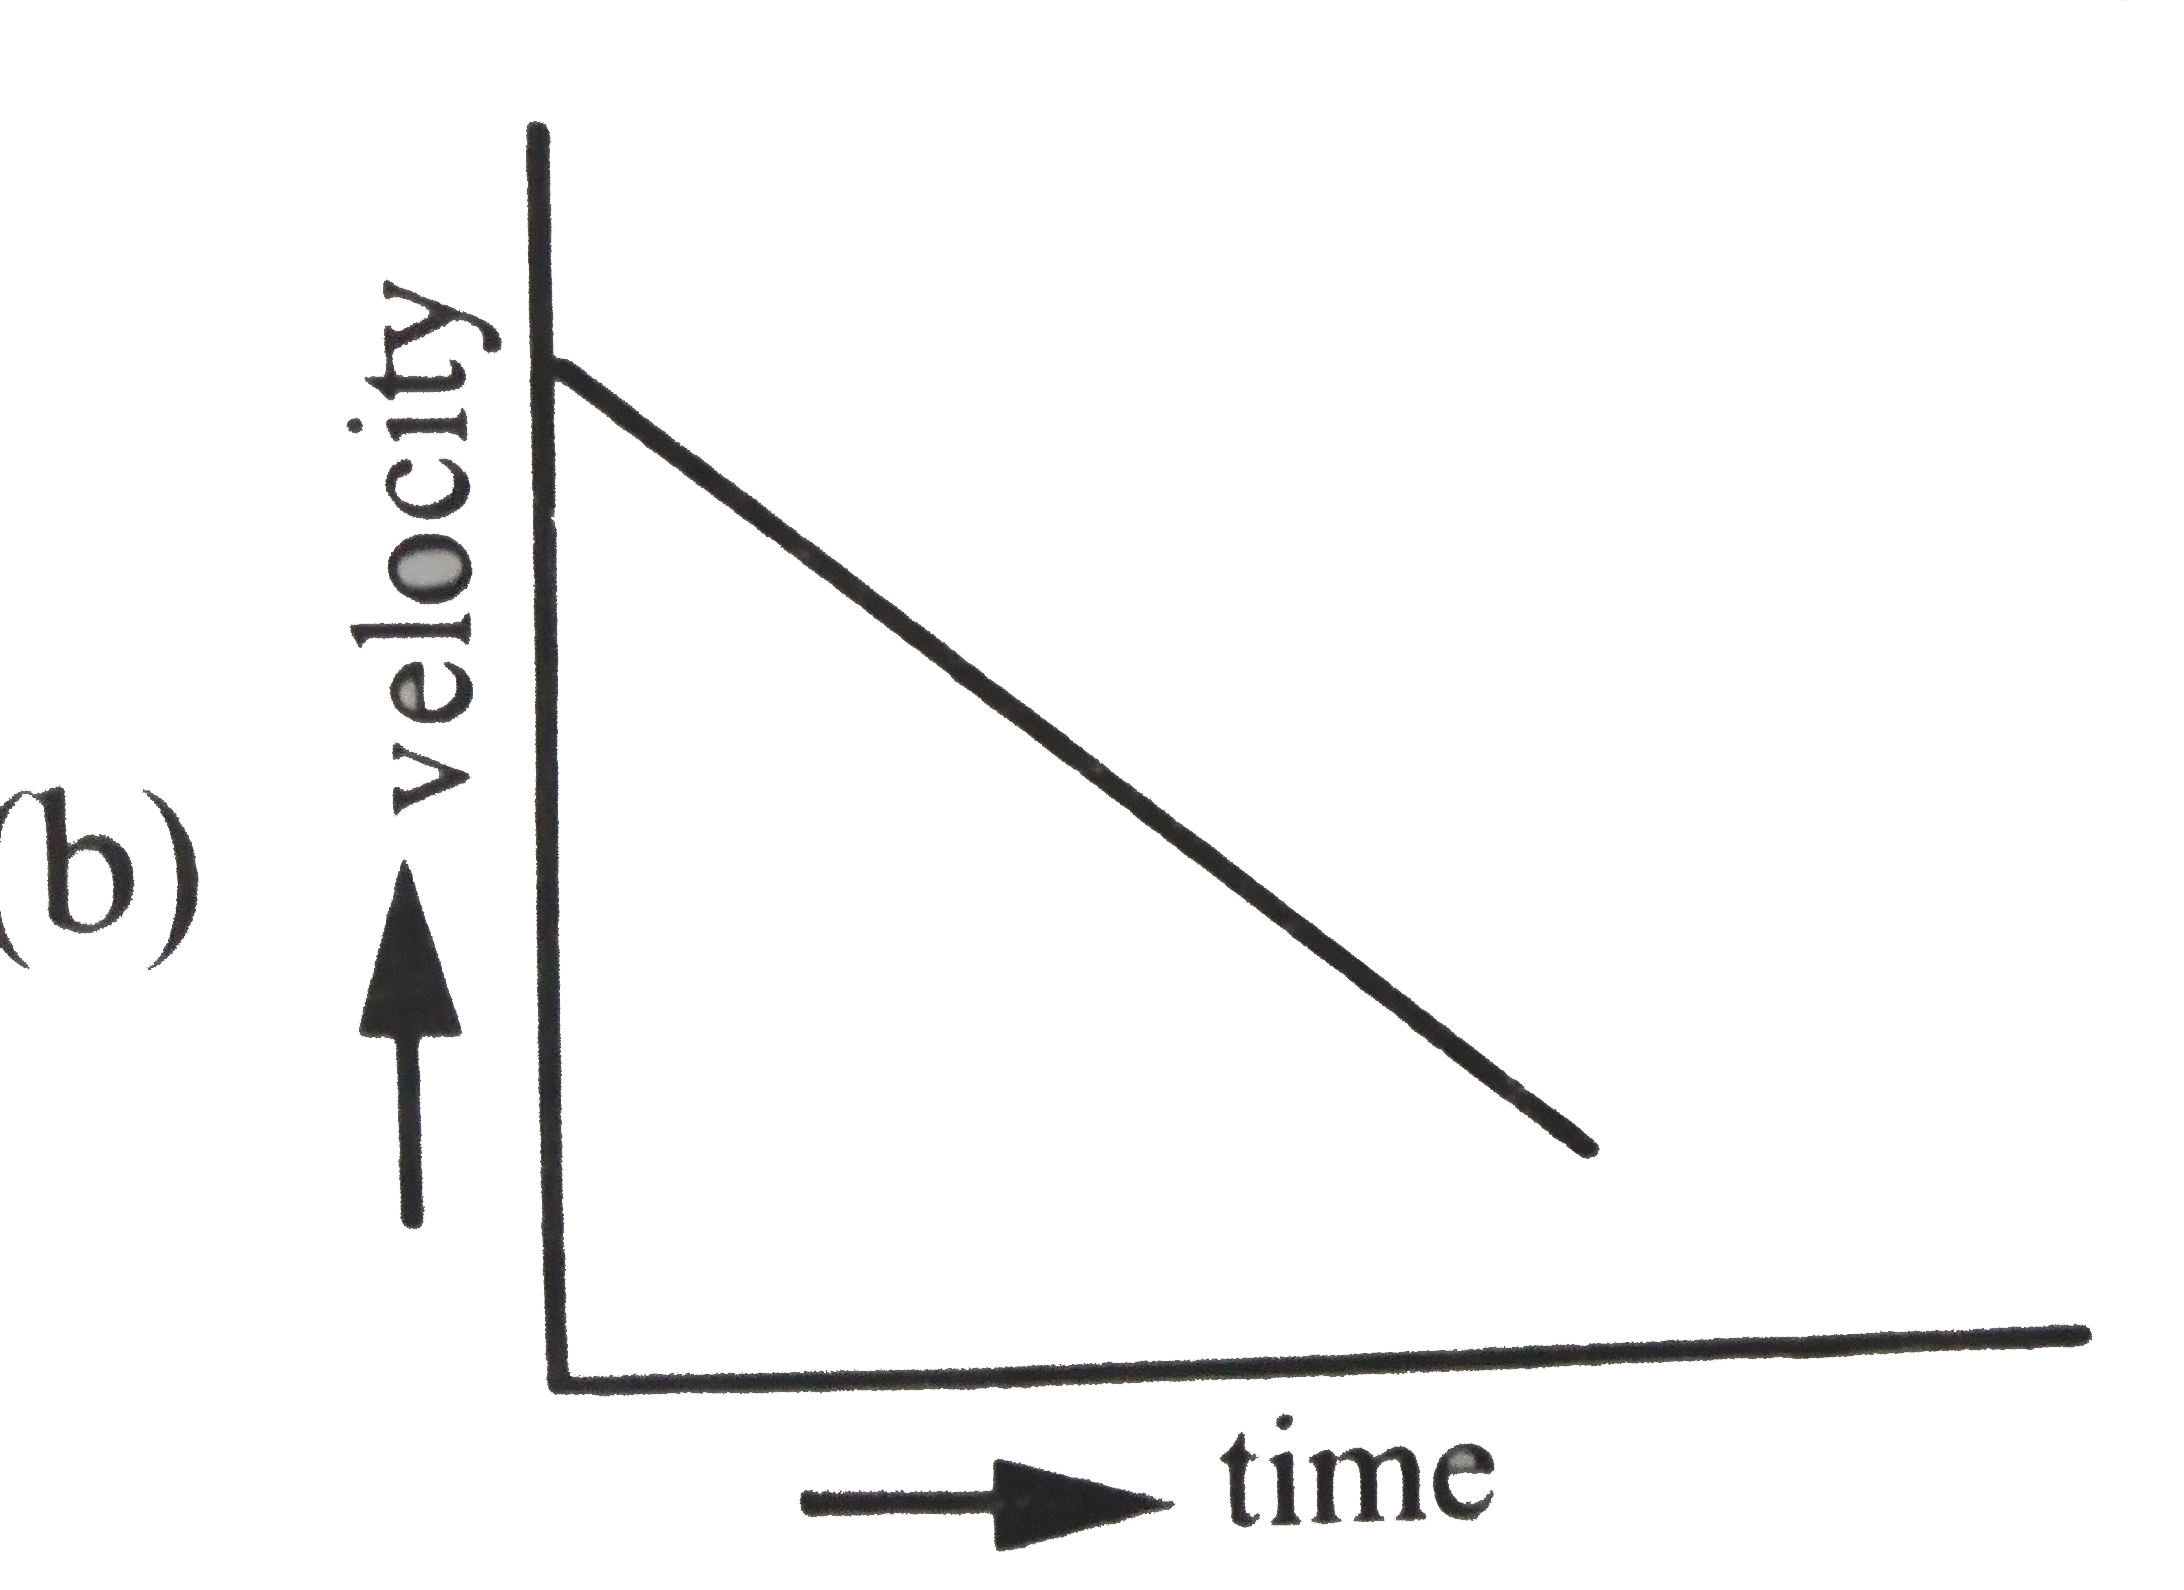
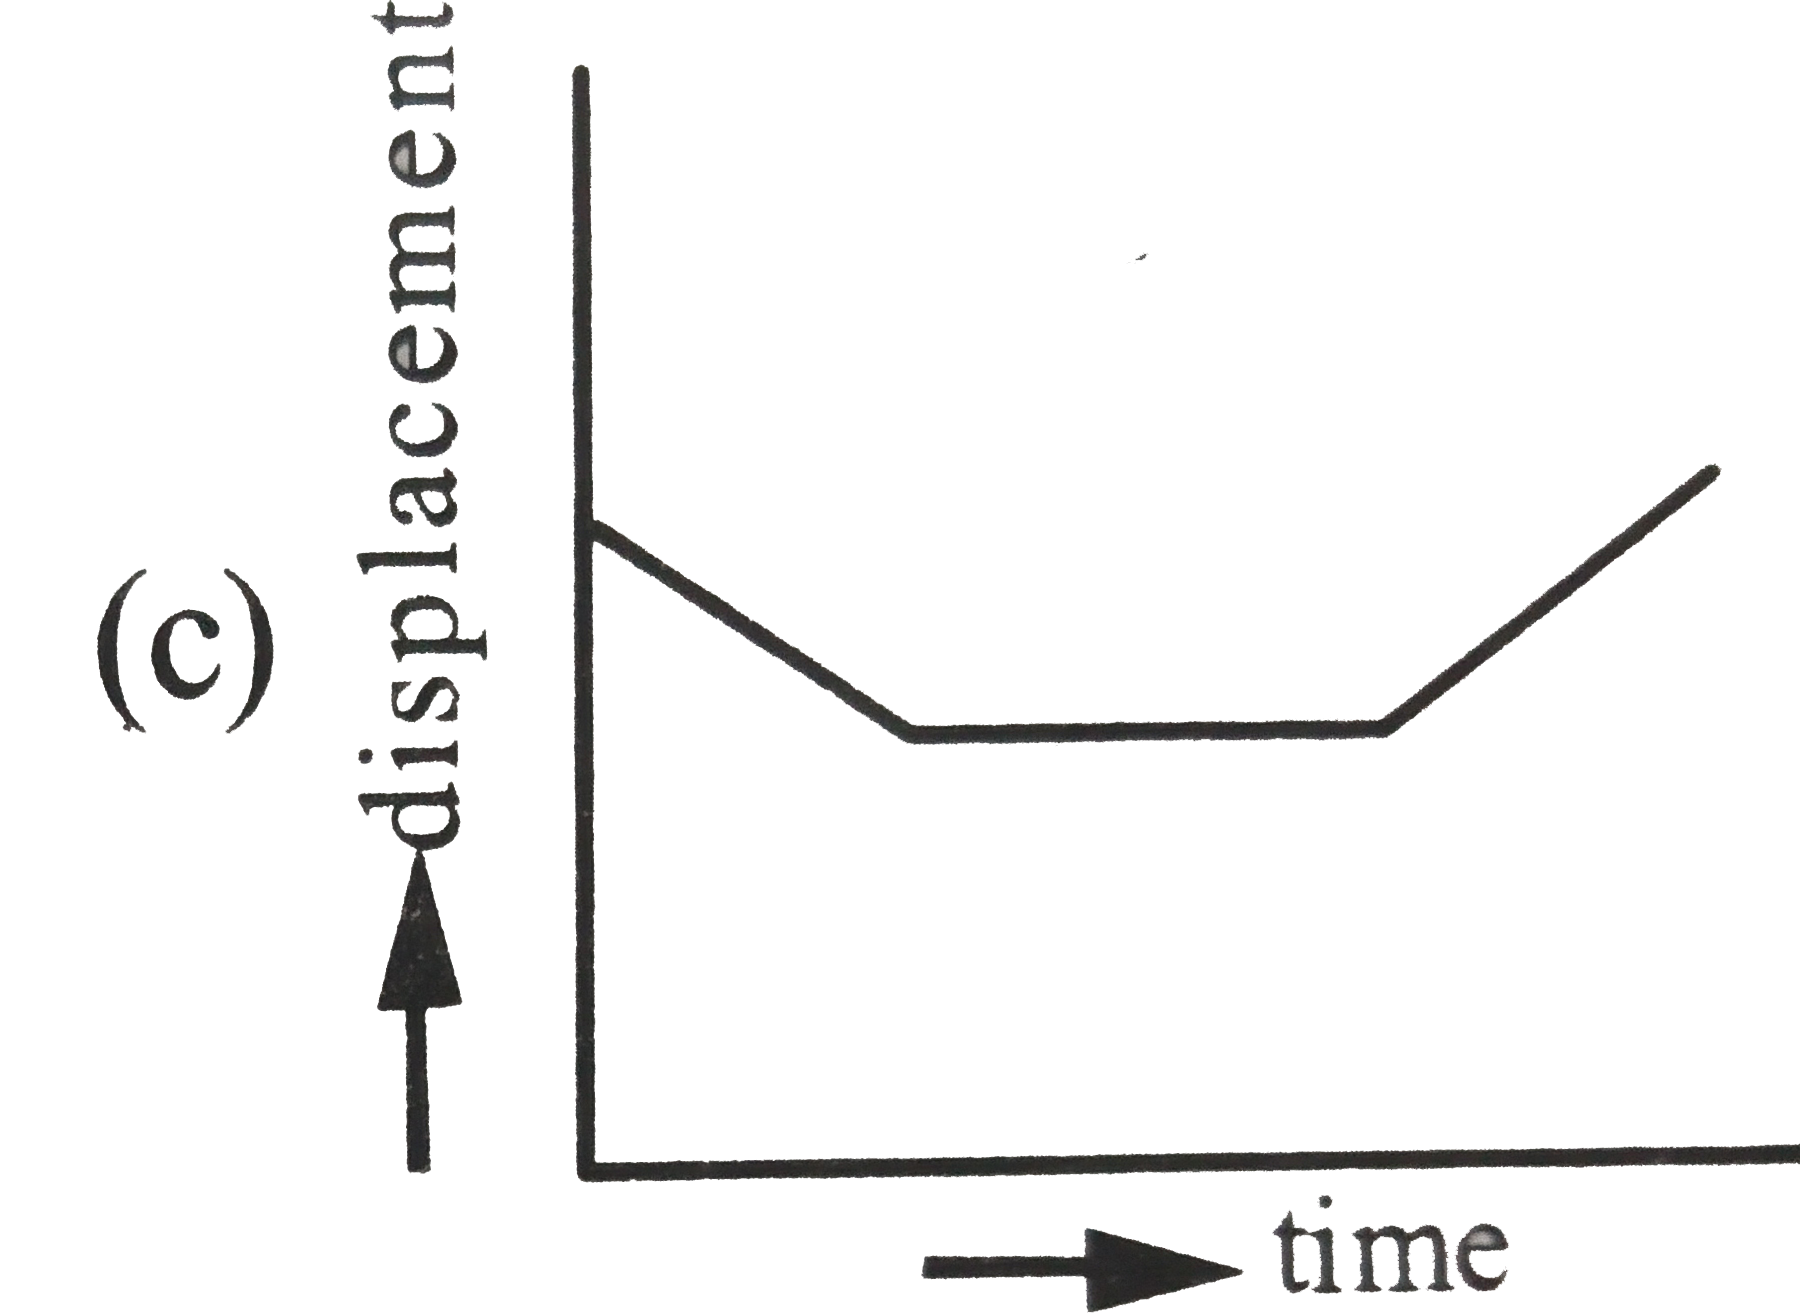
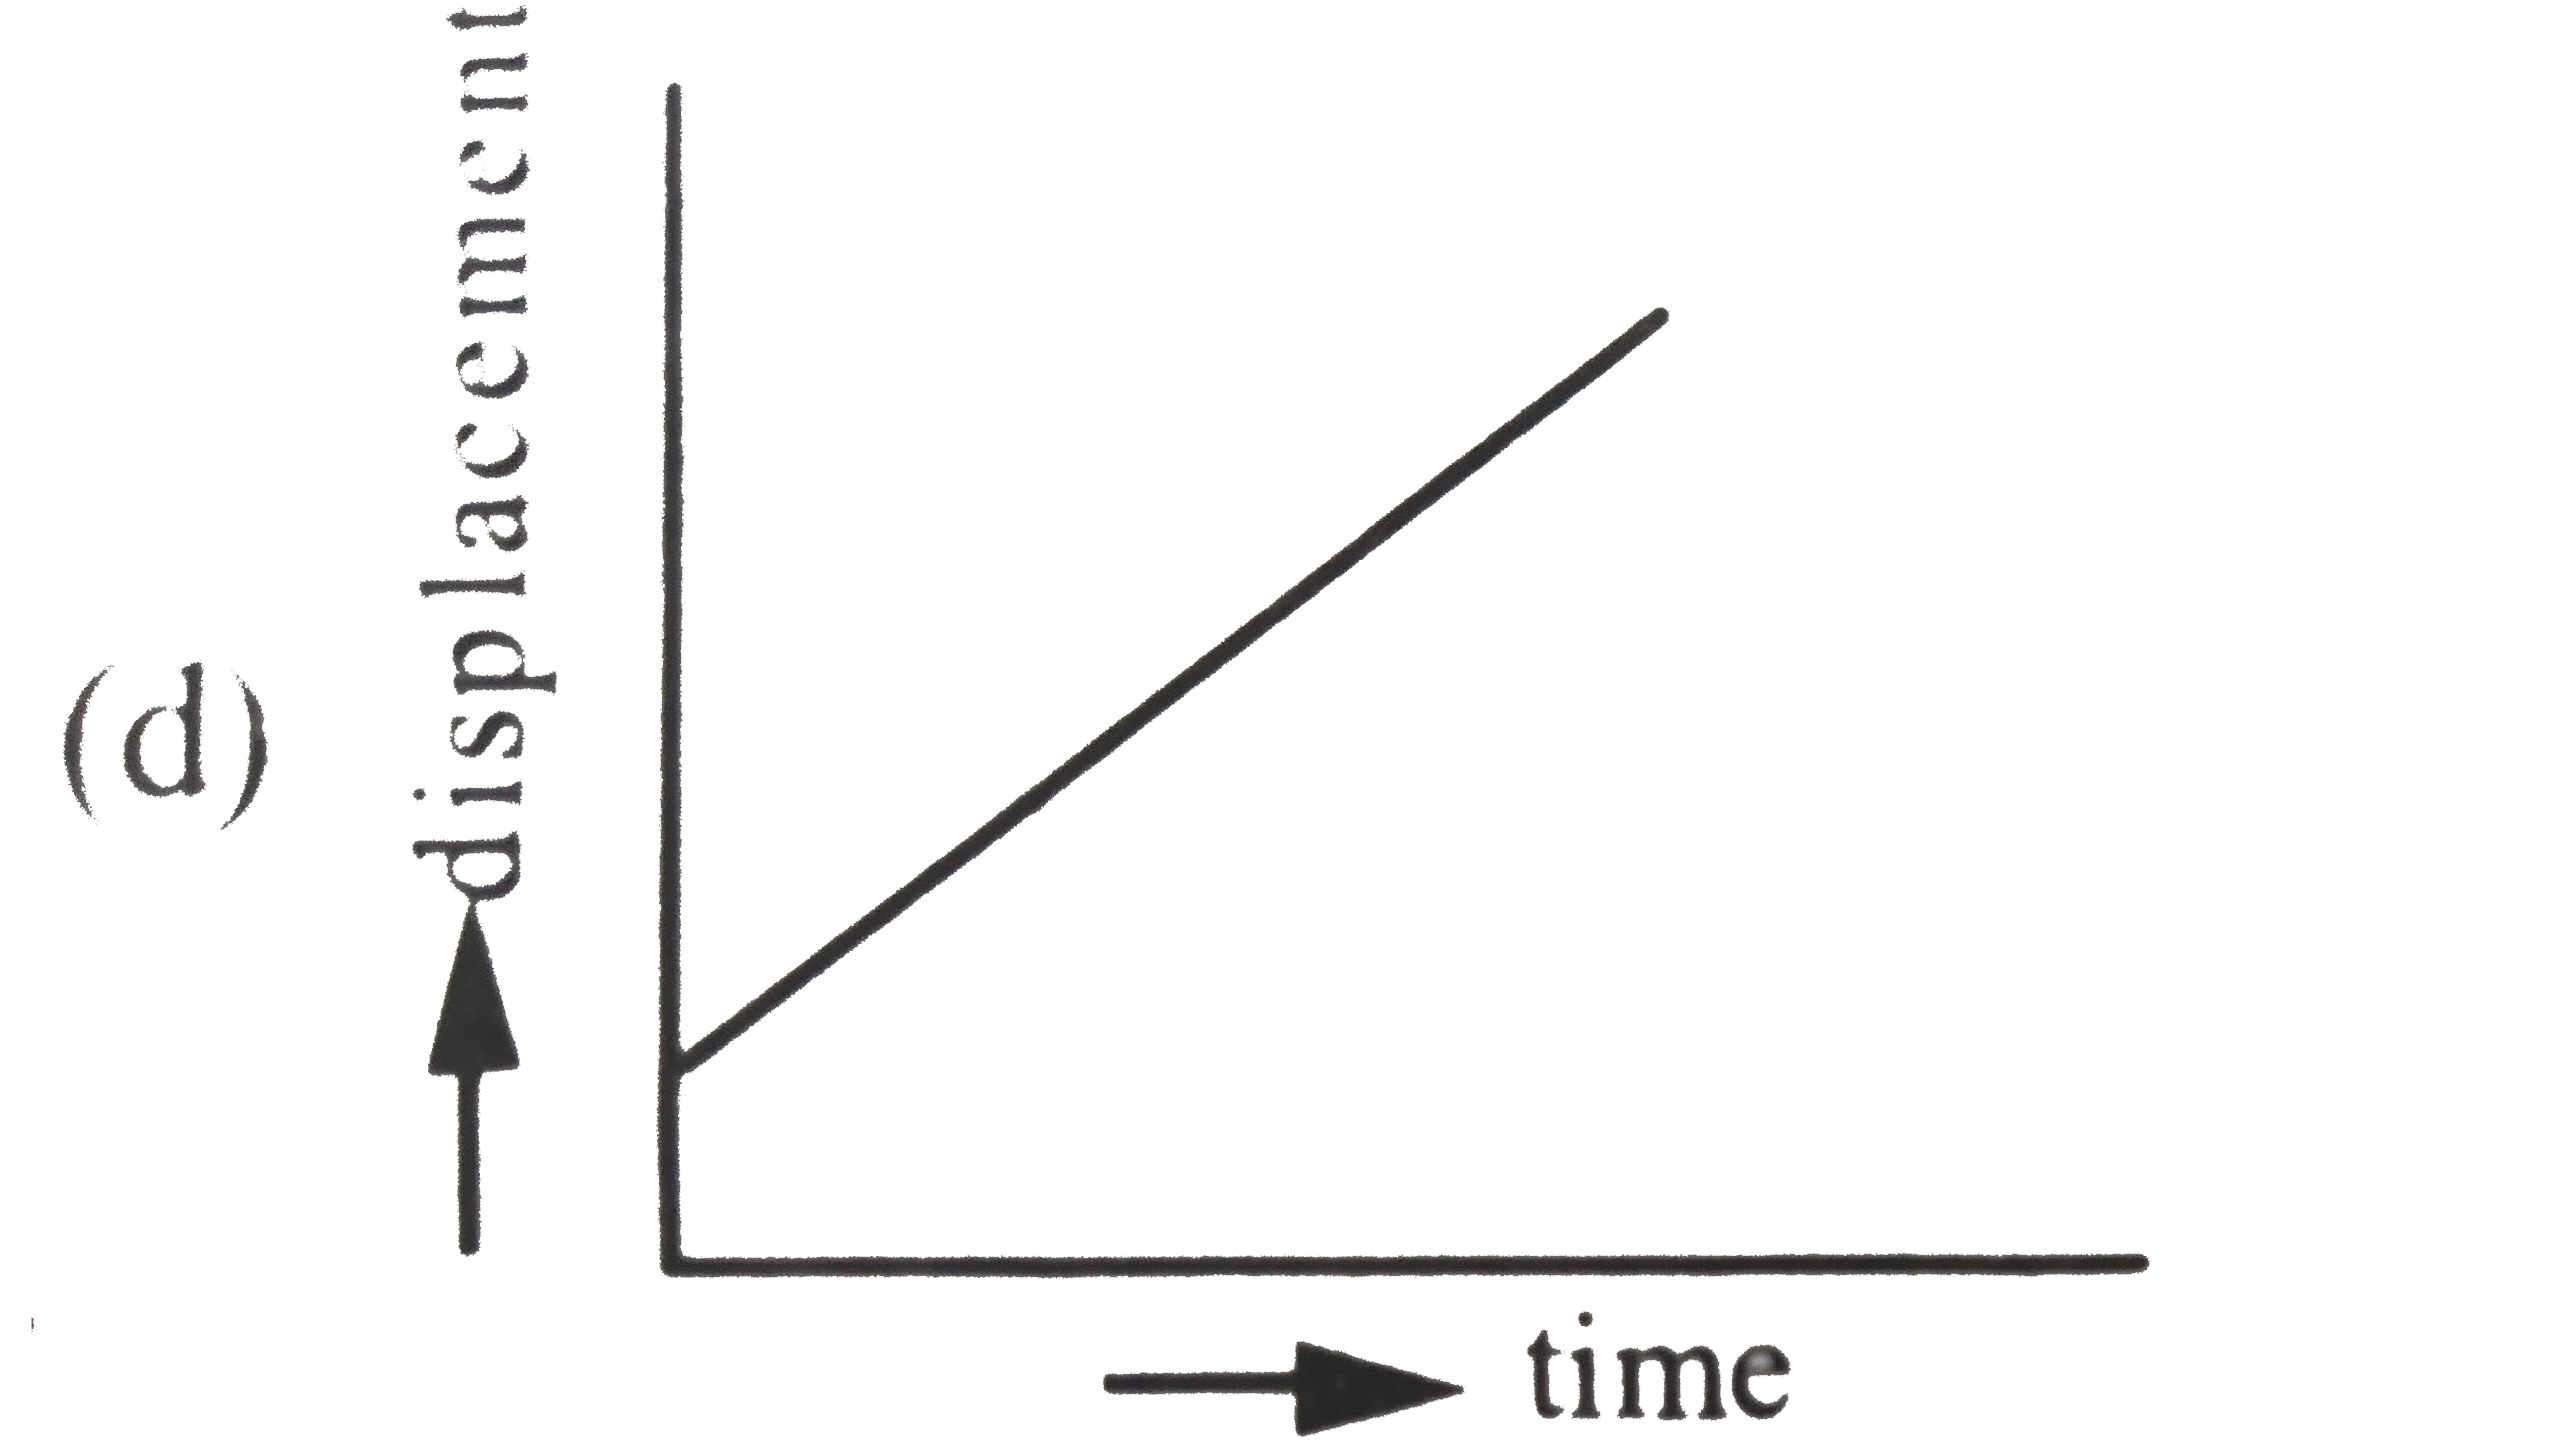
- Which one of the following graphs represents motion?
Text Solution
|
- For a simple pendulum in simple harmonic motion, which of the followin...
Text Solution
|
- A man is sitting on a rotating stool with his arms outstretched. If su...
Text Solution
|
- For a particle revolving in a circular path, the acceleration of the p...
Text Solution
|
- A circus performer of mass M is walking along a wire as shown in the f...
Text Solution
|
- A heavy ball is suspended as shown in the figure given above. A quick ...
Text Solution
|
- Which one of the following characteristics of the particle does the sh...
Text Solution
|
- A body is at rest on the surface of the earth. Which one among the fol...
Text Solution
|
- A pendulum beats, faster than a standard pendulum. In order to bring i...
Text Solution
|
- A body initially at rest is acted upon by a constant force. The rate o...
Text Solution
|
- A jet plane flies through air with a velocity of 2 Mach. While the vel...
Text Solution
|
- A man is at rest in the middle of a pond on perfectly smooth ice. He c...
Text Solution
|
- When a moving bus suddenly applies brakes, the passengers sitting in i...
Text Solution
|
- A jet engine works on the principle of conservation of
Text Solution
|
- Mass of B is four times that of A.B moves with a velocity half that of...
Text Solution
|
- The position- time (x - t) graph for motion of a body is given below: ...
Text Solution
|
- Momentum of a body is 1. a vector quantity. 2. a conserved quantit...
Text Solution
|
- The ratio of the weight of a man in a stationary lift and when it is m...
Text Solution
|