Home
Class 12
PHYSICS
The following figure represents the velo...

The following figure represents the velocity-time graph of a moving car on a road:

Which segment of the graph represents the retardation?

A

AB

B

BC

C

CD

D

none

Text Solution

Verified by Experts

The correct Answer is:
B

BC
Promotional Banner

Topper's Solved these Questions

  • Heat & Thermodynamics

    NDA PREVIOUS YEARS|Exercise Physics|64 Videos
  • MODERN PHYSICS

    NDA PREVIOUS YEARS|Exercise MCQ|42 Videos

Similar Questions

Explore conceptually related problems

Which of the following graphs represents the velocity-time relationship for a falling apple?

The graph below shws the velocity versus time graph for a body Which of the following graph represents the corresponding acceleration v//s time graph?

Draw velocity time graph of a body moving with constant retardation.

The diagram shows the velocity-time graph for a particle moving in a straight line. The sum of the two shaded areas represents :

The velocity-time graph of a car moving along a straight road is shown in figure. The average velocity of the car is first 25 seconds is

The velocity-time graph of a car moving along a straight road is shown in figure. The average velocity of the car in first 25 seconds is

The graph in figure shows the velocity v versus time t for a body. Which of the graphs shown in figure represents the correesponding acceleration versus time graphs ?

Which of the following graphs represents the position time-graph of a particle moving with negative velocity?

Speed - time graph for a car is show in the fig 1.13:Which part of the graph represents uniform motion of the car ?

The velocity-time graph of a body moving in a straight line is shown below: Which one of the following represents its acceleration time graph?

NDA PREVIOUS YEARS-Mechanics-Physics
  1. A brass'ball is tied to a thin wire and swung so as to move uniformly ...

    Text Solution

    |

  2. Which one of the following statements is not correct?

    Text Solution

    |

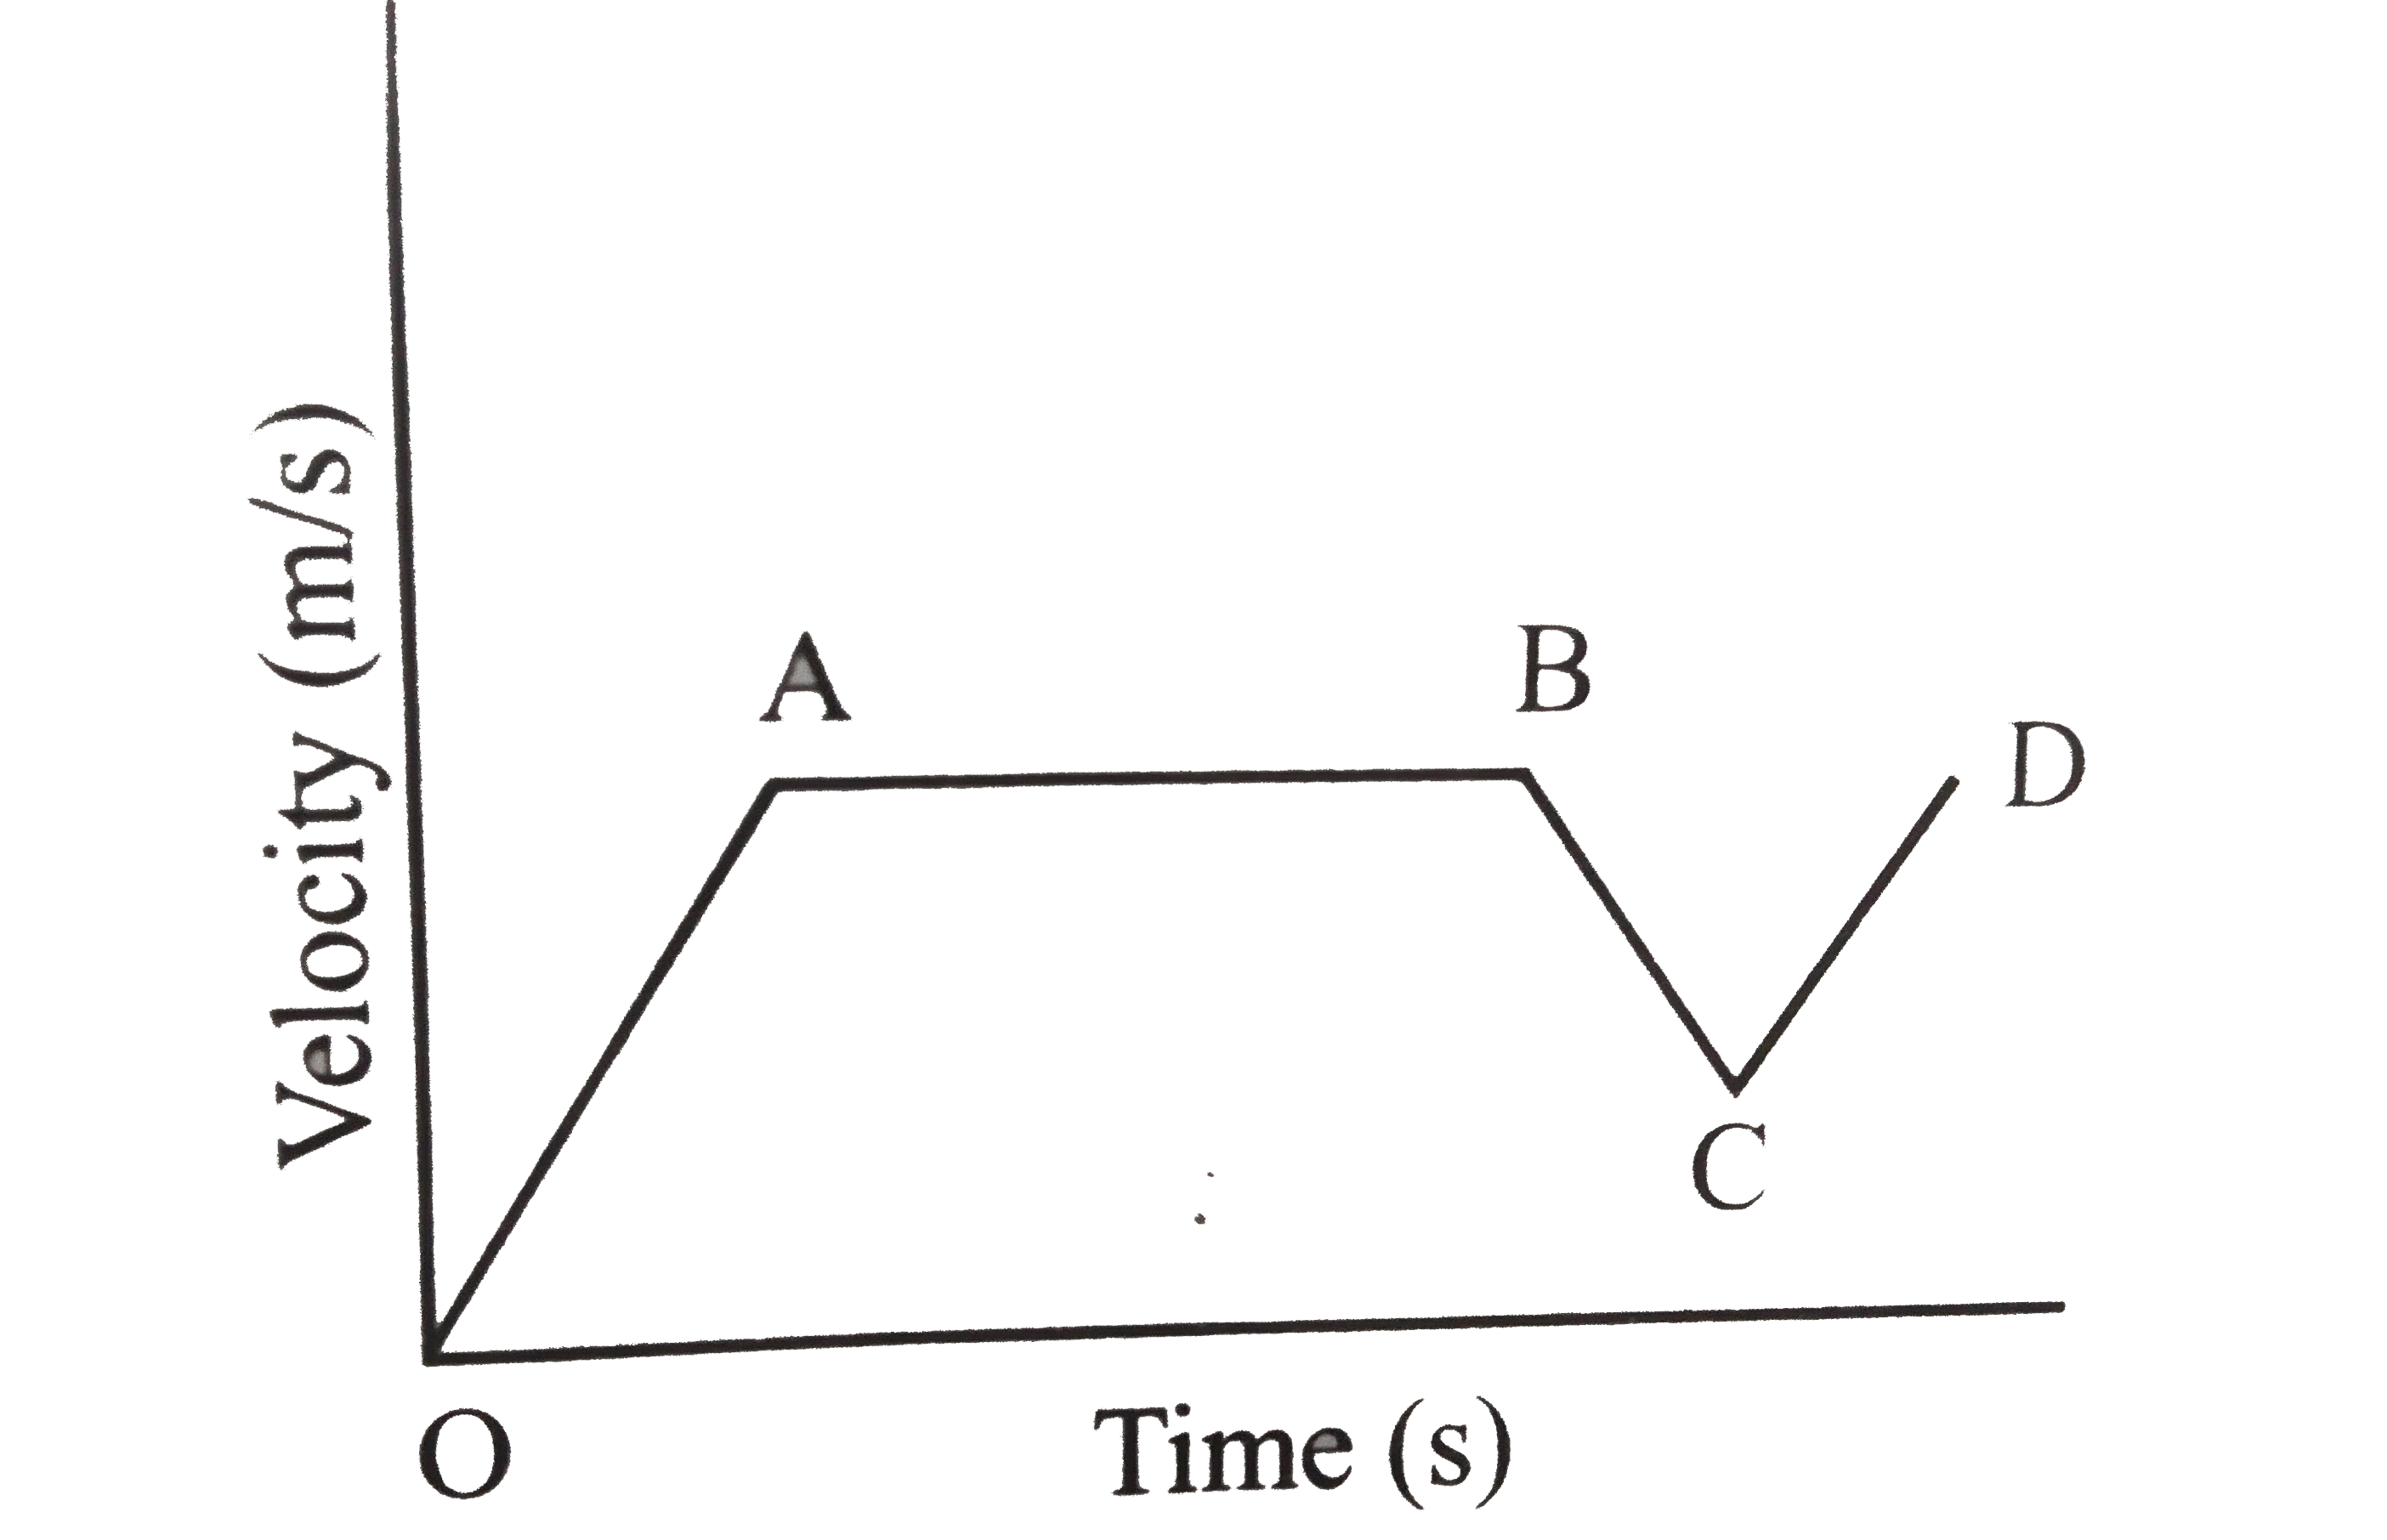
  3. The following figure represents the velocity-time graph of a moving ca...

    Text Solution

    |

  4. A man is sitting in a train which is moving with a velocity of 60 km/h...

    Text Solution

    |

  5. Conservation of momentum in a collision between particles can be under...

    Text Solution

    |

  6. Two forces, one of 3 newton and another of 4 newton are applied on a s...

    Text Solution

    |

  7. In SI unit of force 'Newton' (N) is given by (where m stands for metre...

    Text Solution

    |

  8. The acceleration due to gravity'g' for objects on or near the surface ...

    Text Solution

    |

  9. Suppose the force of gravitation between two bodies of equal masses is...

    Text Solution

    |

  10. A body has a free fall from a height of 20 m. After falling through a ...

    Text Solution

    |

  11. Mass of a particular amount of substance 1. is the amount of matter ...

    Text Solution

    |

  12. Two bod'ies A and B are moving with equal velocities. The mass of B is...

    Text Solution

    |

  13. A glass vessel is filled with water to the rim and a lid is fixed to i...

    Text Solution

    |

  14. A racing car accelerates on a straight road from rest to a speed of 50...

    Text Solution

    |

  15. A man weighing 70 kg is coming down in a lift. If the cable of the lif...

    Text Solution

    |

  16. The impulse on a particle due to a force acting on it during a given t...

    Text Solution

    |

  17. The motion of a car along a straight path is shown by the following fi...

    Text Solution

    |

  18. The speed of a car travelling on a straight road is listed below at su...

    Text Solution

    |

  19. The following figure shows displacement versus time curve for a partic...

    Text Solution

    |

  20. The time period of a simple pendulum made using a thin copper wire of ...

    Text Solution

    |