A
B
C
D
Text Solution
Verified by Experts
The correct Answer is:


Similar Questions
Explore conceptually related problems
Recommended Questions
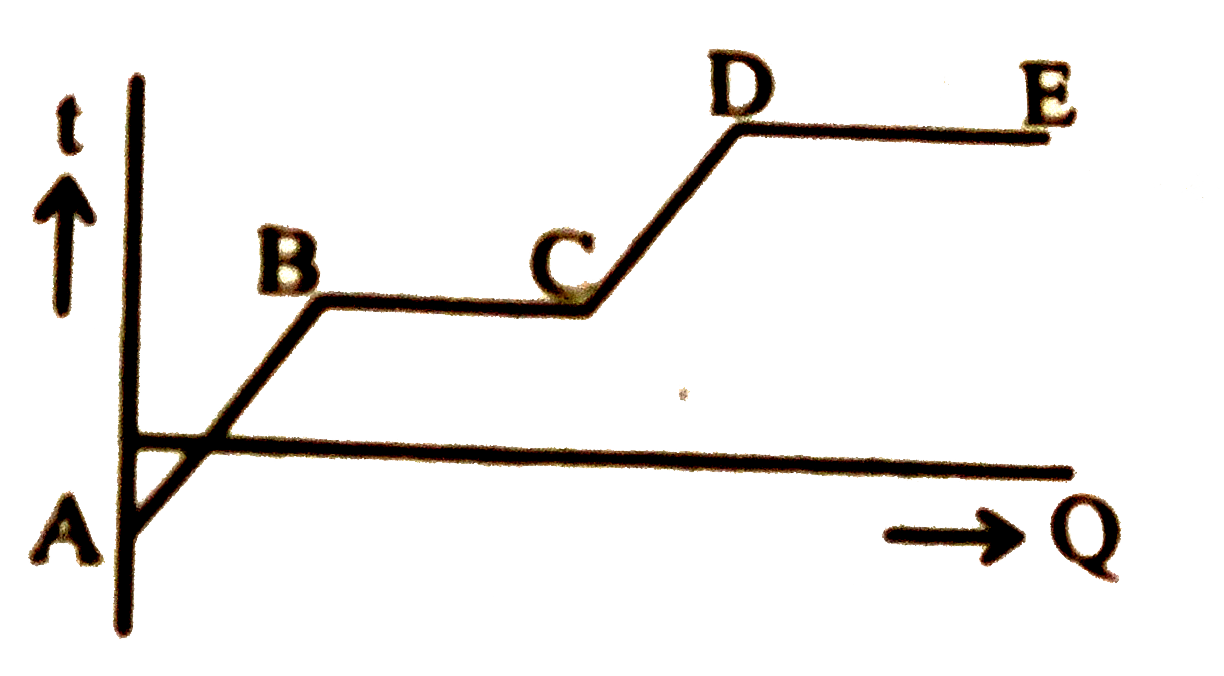
- The graph given above indicates change in temperature (Delta t) when h...
Text Solution
|
- The graph shown in the figure represents change in the temperature of ...
Text Solution
|
- RS part of the graph indicates state of substance
Text Solution
|
- The position- time (x - t) graph for motion of a body is given below: ...
Text Solution
|
- The graph given above indicates change in temperature (Delta t) when h...
Text Solution
|
- Explain the role of latent heat in the change of state of a substances
Text Solution
|
- Role of Latent heat in the change of state of a substances.
Text Solution
|
- Explain the role of latent heat in the change of state of a substance.
Text Solution
|
- बर्फ के गलन की गुप्त ऊष्मा 80 कैलोरी/ग्राम तथा भाप की गुप्त ऊष्मा 540 ...
Text Solution
|