A
B
C
D
Text Solution
Verified by Experts
The correct Answer is:


Similar Questions
Explore conceptually related problems
Recommended Questions
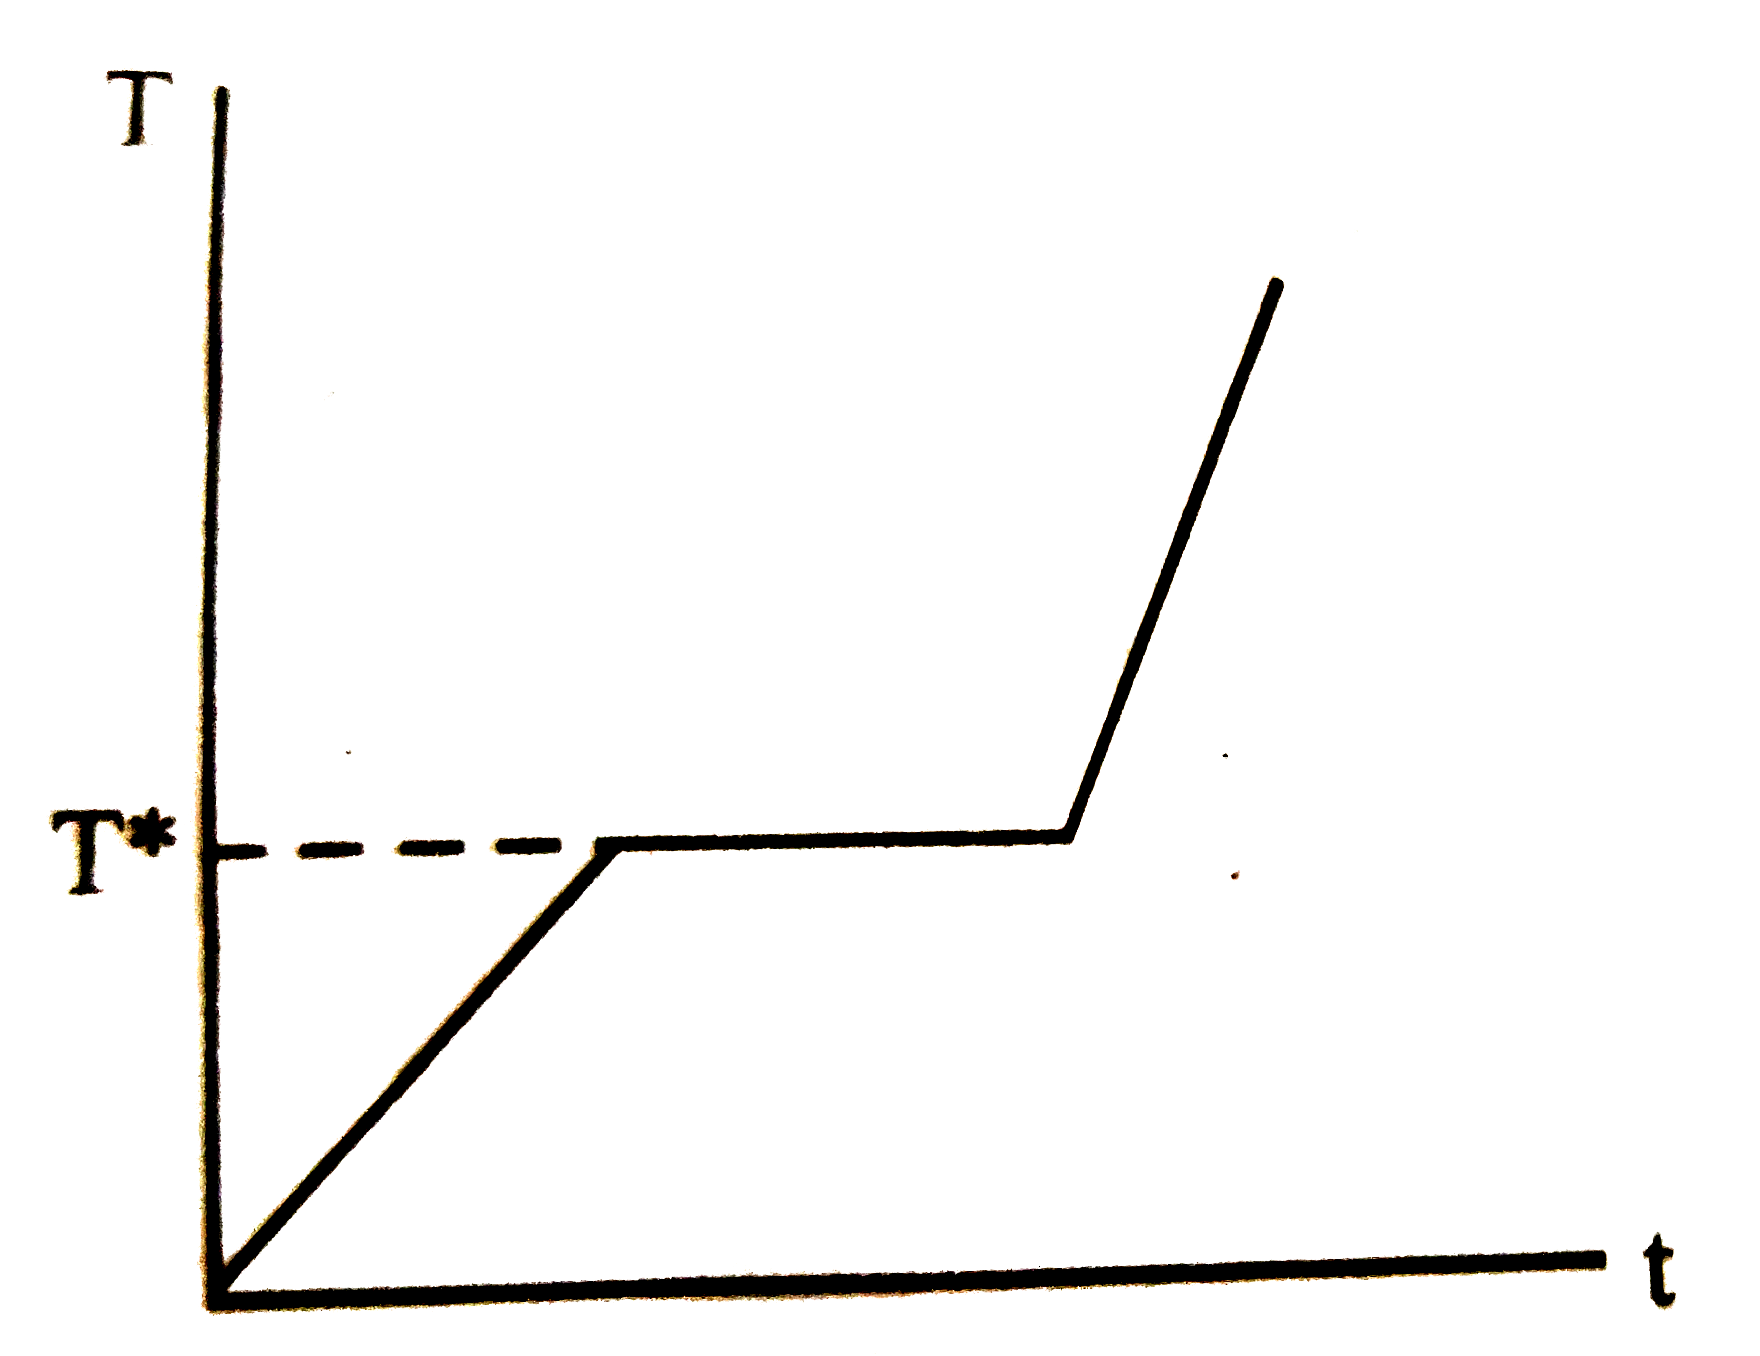
- The figure given above shhows the tempreture (T)-time (t) plot when we...
Text Solution
|
- If a piece of metal is heated to temperature theta and the allowed to ...
Text Solution
|
- The force F acting on a particle plotted against time t is shown in fi...
Text Solution
|
- The plot given above represents displacement 'x' of a particle with ti...
Text Solution
|
- The figure given above shhows the tempreture (T)-time (t) plot when we...
Text Solution
|
- धातु के एक टुकड़े को ताप theta तक गर्म करके एक कमरे में ठण्डा होने क...
Text Solution
|
- धातु के एक टुकड़े को ताप theta तक गर्म करके एक कमरे में ठण्डा होने क...
Text Solution
|
- If a piece of metal is heated to temperature theta and then allowed to...
Text Solution
|
- একটি ধাতুখন্ডকে theta উষ্ণতা পর্যন্ত উত্তপ্ত করা হল এবং theta0 উষ্ণত...
Text Solution
|