


Similar Questions
Explore conceptually related problems
Recommended Questions
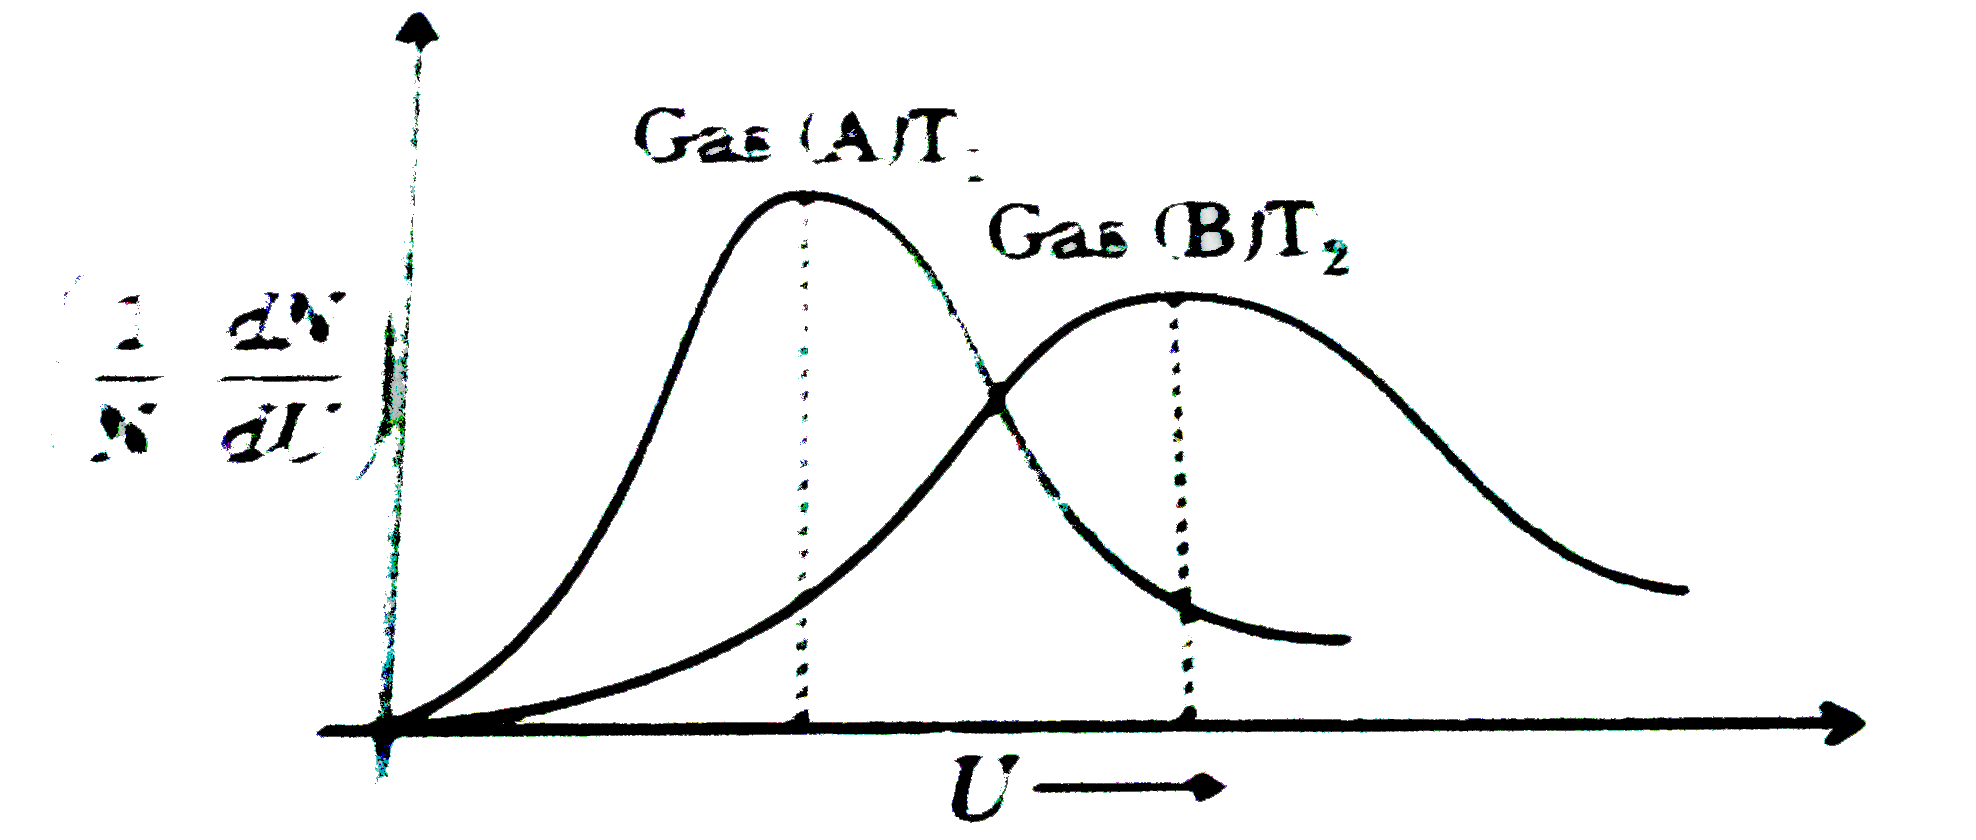
- For the following graph, drawn from two different samples of gases at ...
Text Solution
|
- V- I graph for a metallic wire at two different temperature T(1) and T...
Text Solution
|
- If two gases A and B and temperatures T(A) and T(B) respectively have ...
Text Solution
|
- For the following graph, drawn from two different samples of gases at ...
Text Solution
|
- The current (I) and voltage (V) graphs for a given metallic wire at tw...
Text Solution
|
- The stress-strain graph for a metallic wire is shown at two different ...
Text Solution
|
- I-V graph for a metallie wire at two different tempearture, T(1)and T(...
Text Solution
|
- एक दिये हुए धातु के तार के लिये दो विभिन्न तापों T(1) व T(2...
Text Solution
|
- दो पिण्ड विभिन्न तापों T(1) व T(2) पर हैं । यदि उन्हें उष्मीय संपर्क ...
Text Solution
|