


Similar Questions
Explore conceptually related problems
Recommended Questions
- In the study of a photoelectric effect the graph between the stopping ...
Text Solution
|
- In the study of a photoelectric effect the graph between the stopping ...
Text Solution
|
- In a photoelectric effect experiment, the graph between the stopping p...
Text Solution
|
- The graph shows variation of stopping potential V(0) versus frequency ...
Text Solution
|
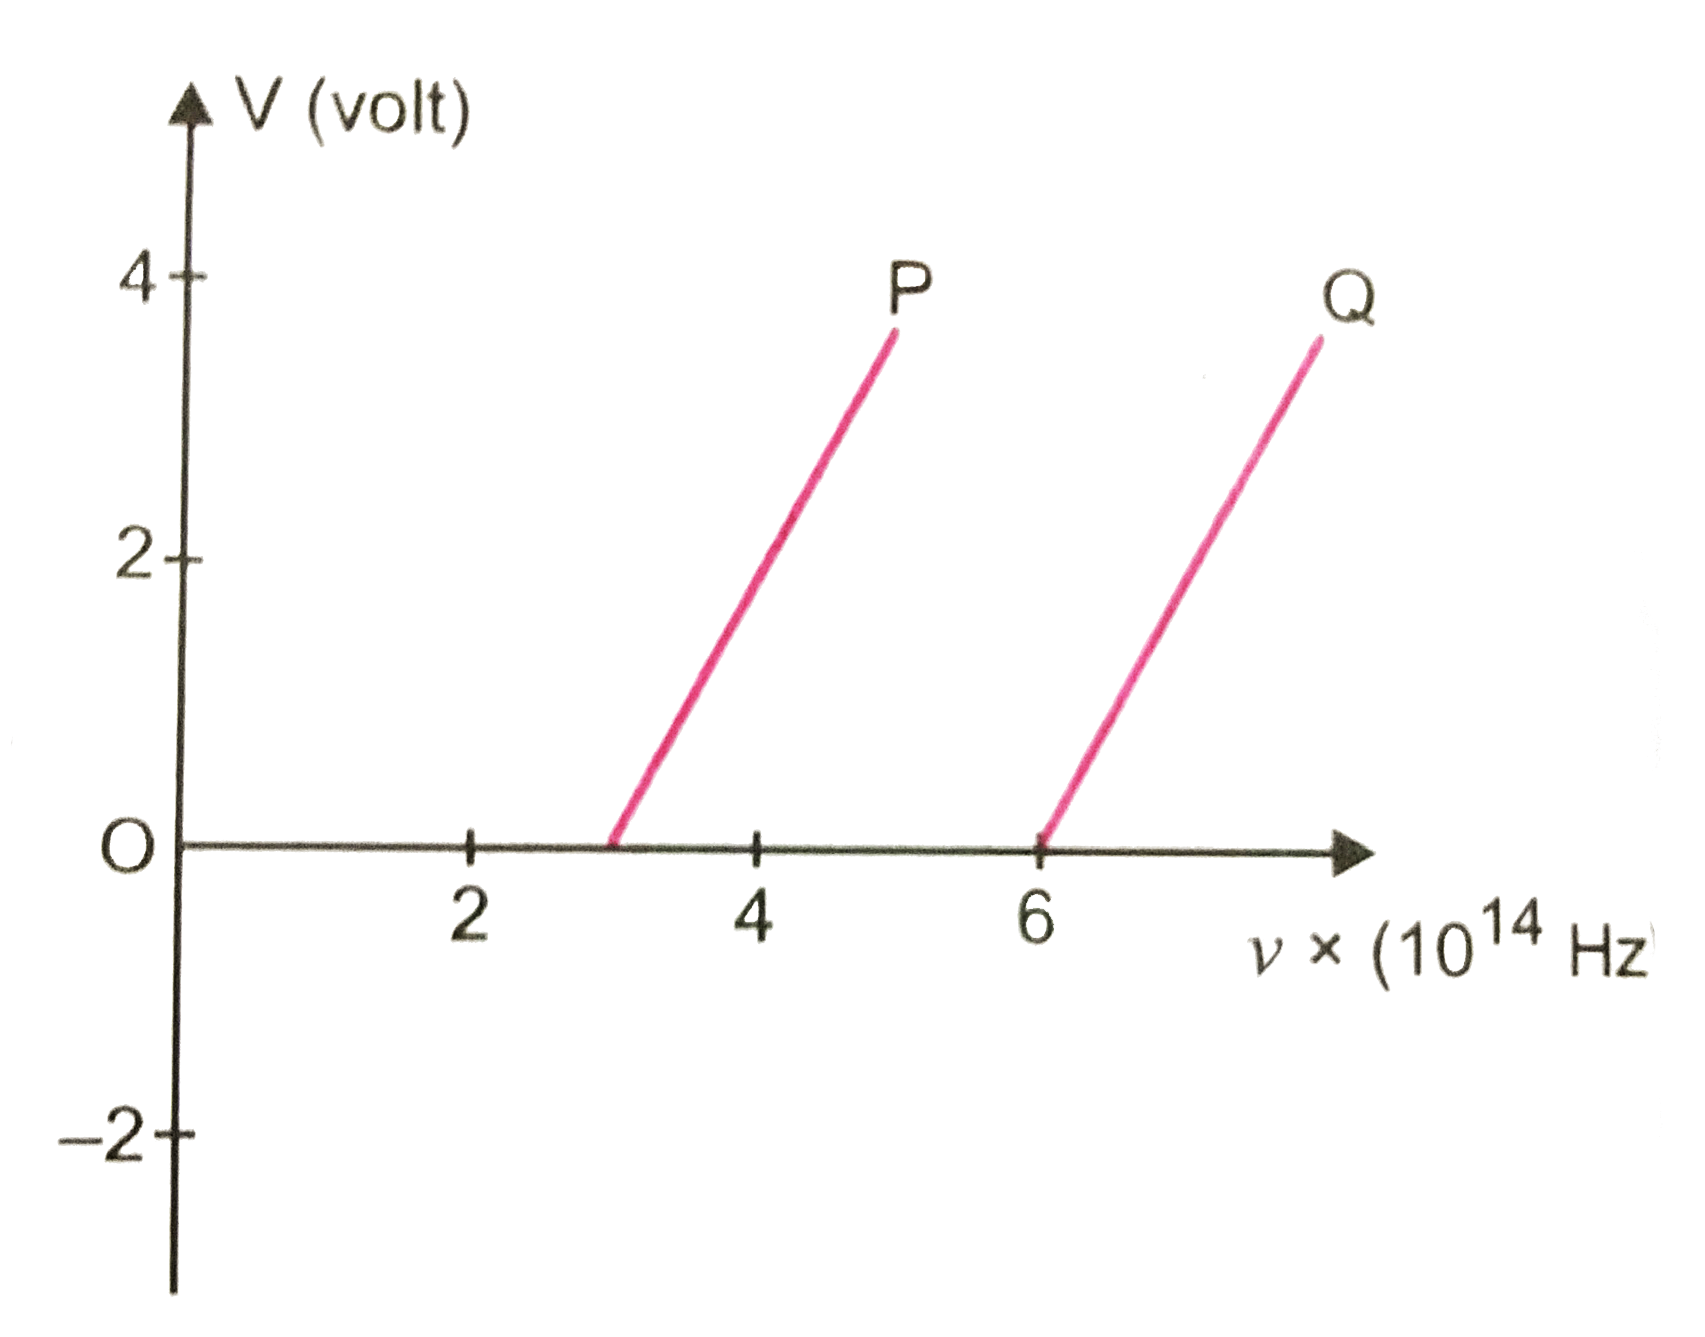
- The graph between the stopping potential V(0) and frequency v for two ...
Text Solution
|
- दो धातुऔ A व B के लिये आपतित प्रकाश की आवृती (v) तथा उत्सर्जित इलेक...
Text Solution
|
- The photoelectric threshold frequency of a metal is v0. When ligth of ...
Text Solution
|
- The photoelectric threshold frequency of a metal is v. When light of f...
Text Solution
|
- चित्र में प्रकाश - वैद्युत प्रभाव में उत्सर्जित फोटो इलेक्ट्रॉनों की अ...
Text Solution
|