 .
.


Similar Questions
Explore conceptually related problems
Recommended Questions
- Fig. 2 (NCT). 10 . Give a speed-tiem graph of a particle in one dimens...
Text Solution
|
- Fig. 2 (NCT).9 show the x-t plot of a particle in one dimensional moti...
Text Solution
|
- Fig. 2 (NCT). 10 . Give a speed-tiem graph of a particle in one dimens...
Text Solution
|
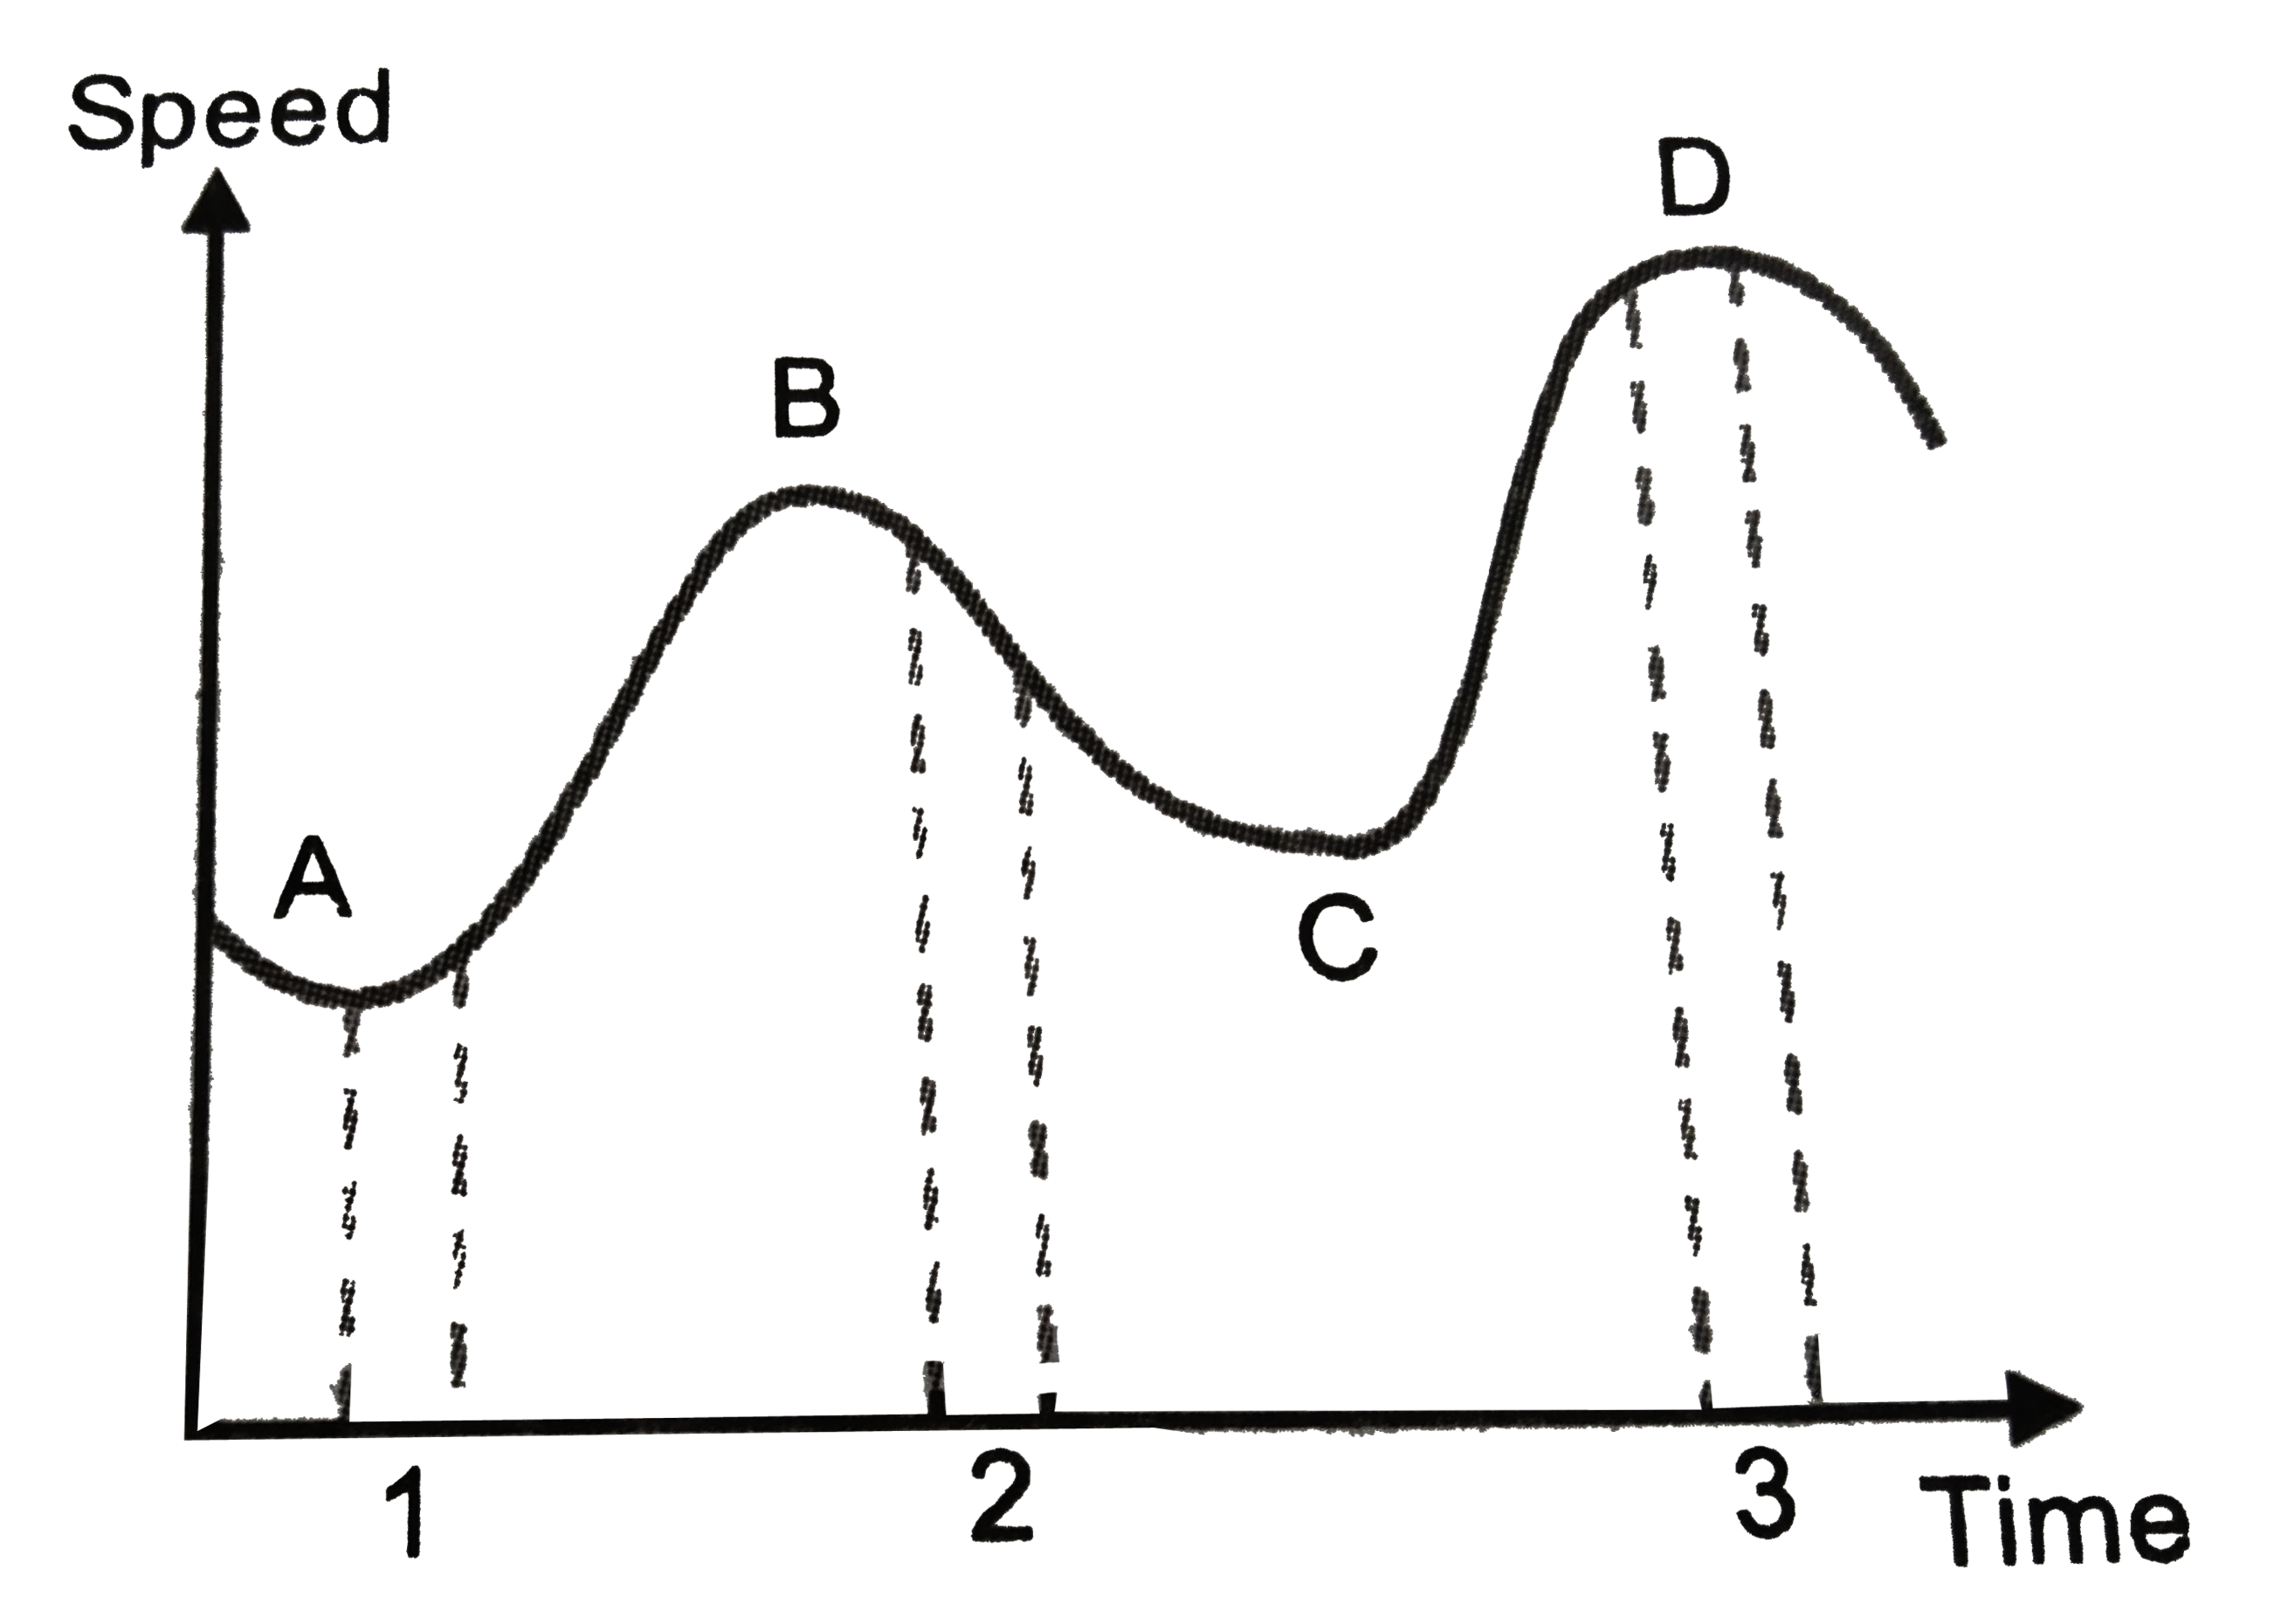
- चित्र में किसी नियत (स्थिर) दिशा के अनुदिश चल रहे कण का चाल-समय ग्राफ ...
Text Solution
|
- Figure. gives the x-t plot of a particle in one-dimensional motion. Th...
Text Solution
|
- Figure. gives a speed-time graph of a particle in motion along a const...
Text Solution
|
- Figure. gives the x-t plot of a particle in one-dimensional motion. Th...
Text Solution
|
- Figure. gives a speed-time graph of a particle in motion along a const...
Text Solution
|
- Figure. gives the x-t plot of a particle in one-dimensional motion. Th...
Text Solution
|