


Similar Questions
Explore conceptually related problems
Recommended Questions
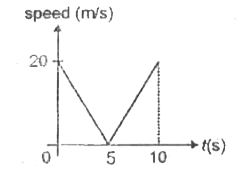
- The speed - time graph for a body moving along a straight line is show...
Text Solution
|
- A body with constant acceleration always moves along a straight line. ...
Text Solution
|
- The x-t graph of a particle moving along a straight line is shown in f...
Text Solution
|
- The velocity time graph of a body moving along a straight line is show...
Text Solution
|
- The velocity-time graph of a body moving in a straight line is shown i...
Text Solution
|
- The distance -time graph of a body moving in a straight line is shown ...
Text Solution
|
- A body is moving with variable acceleartion (a) along a straight line....
Text Solution
|
- The speed - time graph for a body moving along a straight line is show...
Text Solution
|
- The velocity versus time graph of a body moving along a straight line ...
Text Solution
|