A
B
C
D
Text Solution
Verified by Experts
The correct Answer is:


Similar Questions
Explore conceptually related problems
Recommended Questions
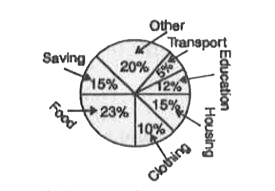
- The circle graph given here shows the spendings by a family on various...
Text Solution
|
- The circle graph given here shows the spendings of a country on variou...
Text Solution
|
- The circle graph given here shows the spendings of a country on variou...
Text Solution
|
- The circle graph given here shows the spendings of a country on variou...
Text Solution
|
- The circle graph given here shows the spendings of a country on variou...
Text Solution
|
- The circle - graph given here shows the spendings of a country on vari...
Text Solution
|
- The circle - graph given here shows the spendings of a country on vari...
Text Solution
|
- The circle - graph given here shows the spendings of a country on vari...
Text Solution
|
- The pie chart given below shows the spendings of a family on various h...
Text Solution
|