


Similar Questions
Explore conceptually related problems
Recommended Questions
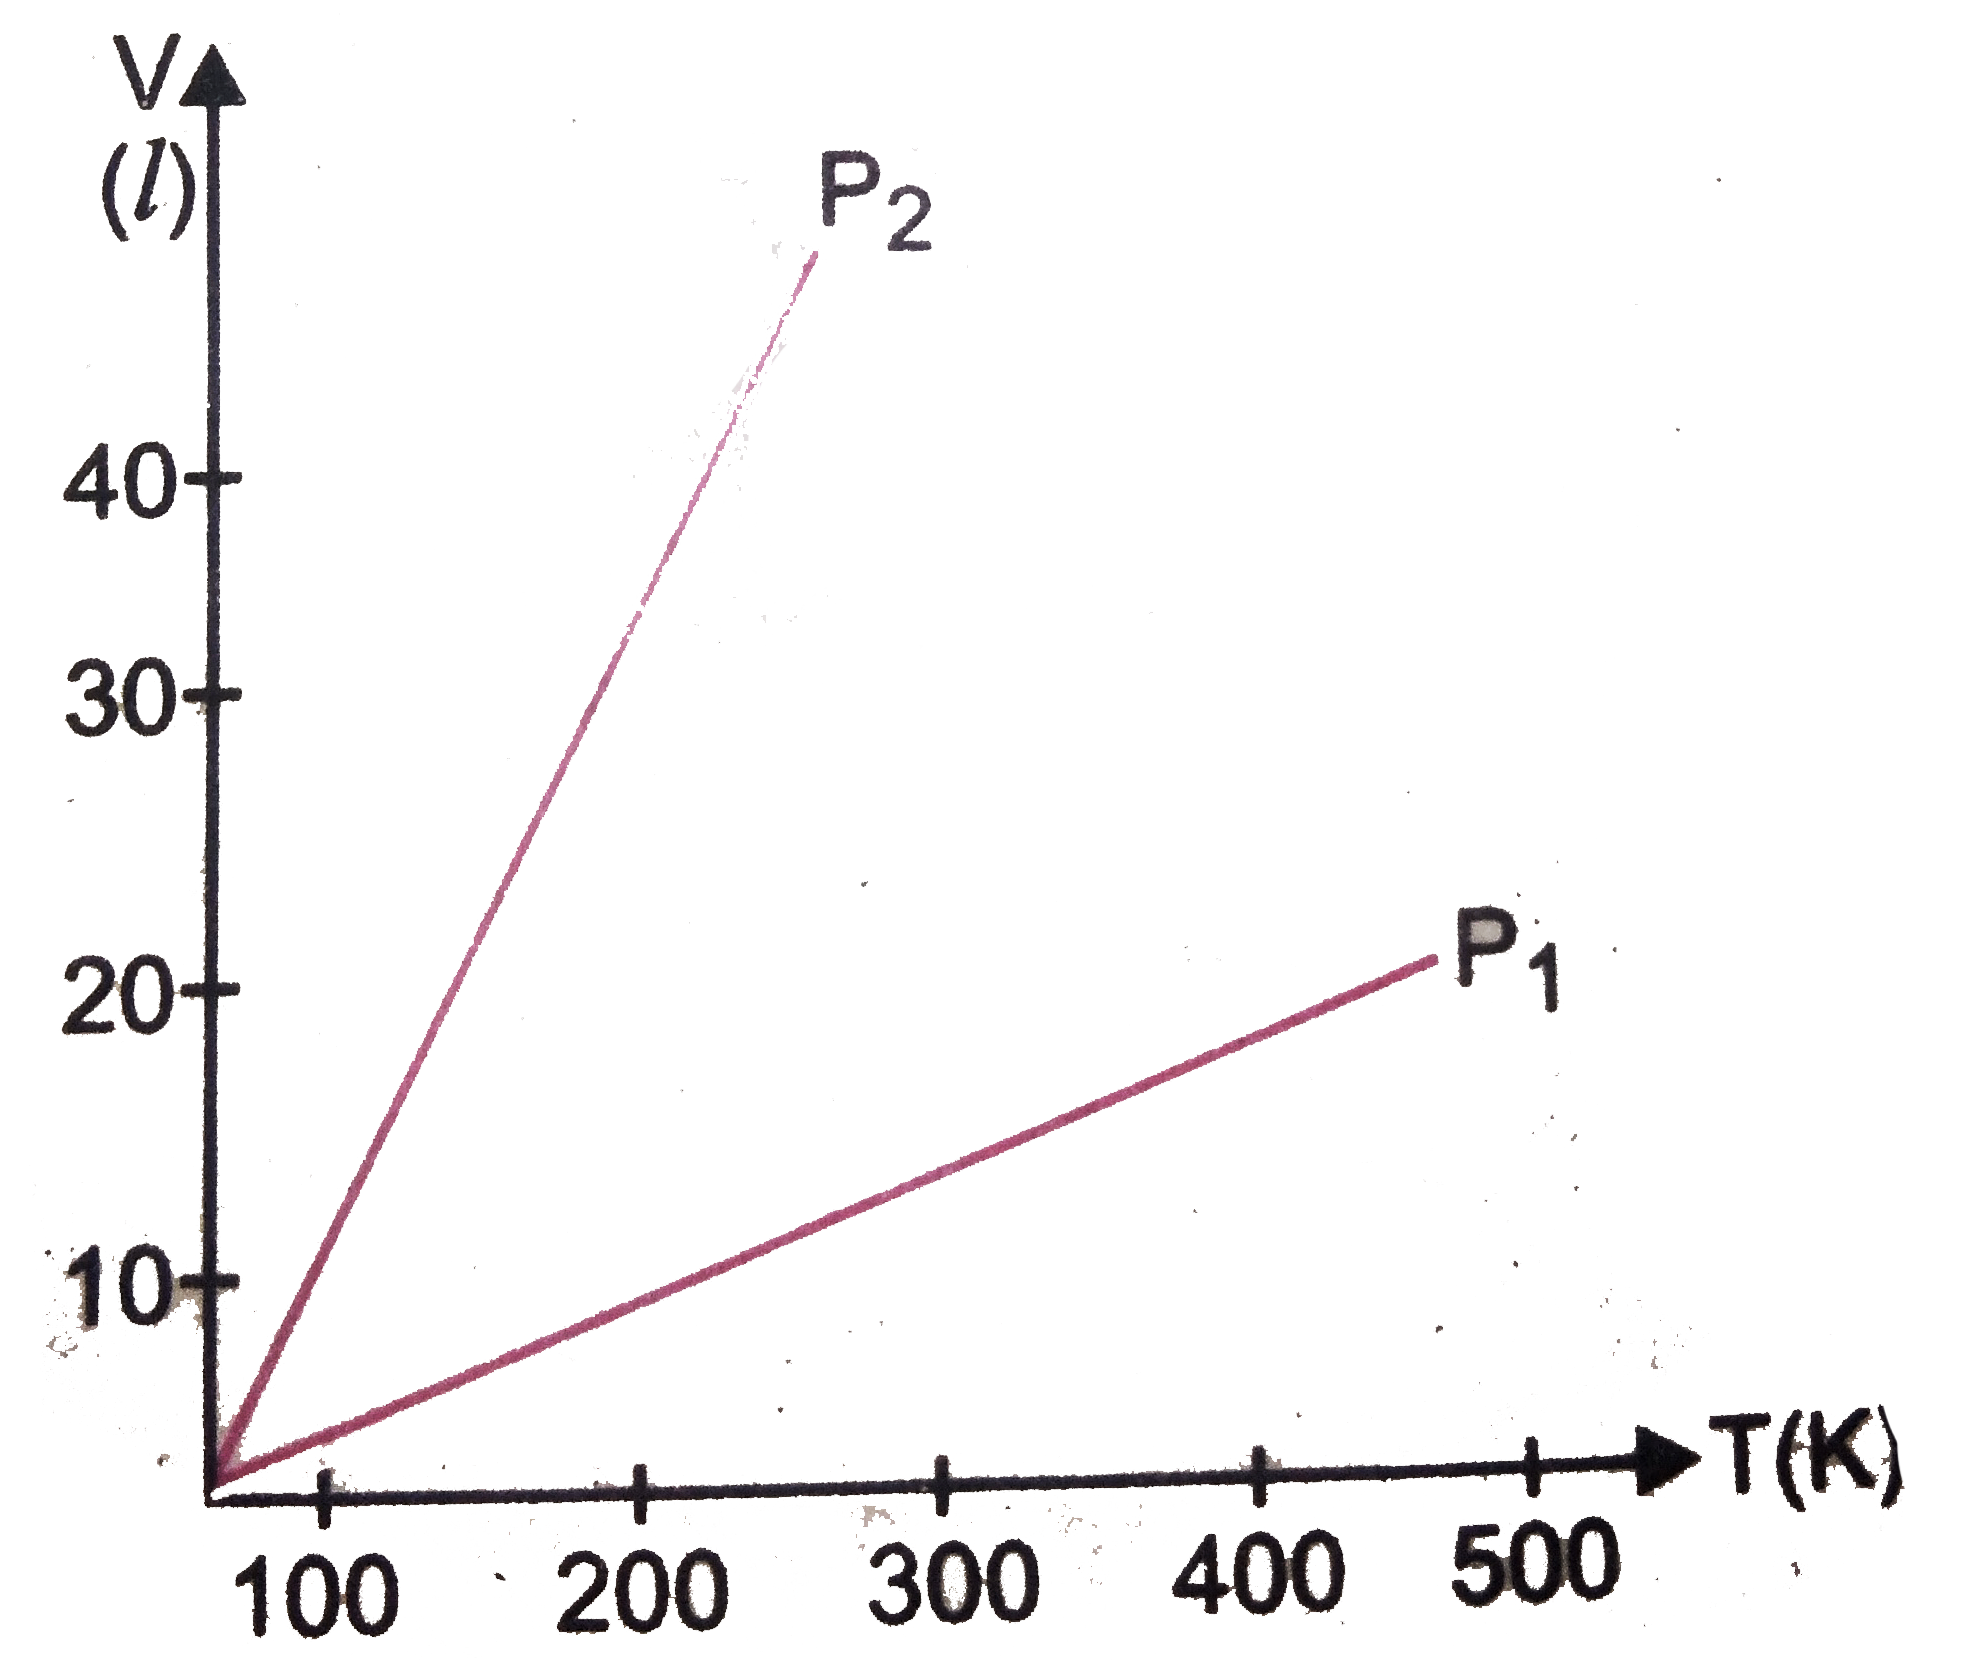
- Volume versus temperature graphs for a given mass of an ideal gas are ...
Text Solution
|
- Pressure versus temperature graph of an ideal gas as shown in Fig. Cor...
Text Solution
|
- Figure shows the volume versus temperature graph for the same mass of ...
Text Solution
|
- Volume versus temperature graphs for a given mass of an ideal gas are ...
Text Solution
|
- Pressure versus temperature graph of an ideal gas is shown in figure. ...
Text Solution
|
- Pressure versus temperature graph of an ideal gas at constant volume V...
Text Solution
|
- Volume versus temperature graphs for a given mass of an ideal gas are ...
Text Solution
|
- The volume-temperature graphs of a given mass of an ideal gas at const...
Text Solution
|
- दाब के दो मानों p(1) तथा p(2) पर एक आदर्श गैस की एक निश्चित मात्रा क...
Text Solution
|