Text Solution
Verified by Experts


Topper's Solved these Questions
GRAPHICAL REPRESENTATION OF DATA
FULL MARKS|Exercise ADDITIONAL QUESTIONS SOLVED (VERY SHORT ANSWER QUESTIONS)|11 VideosGRAPHICAL REPRESENTATION OF DATA
FULL MARKS|Exercise ADDITIONAL QUESTIONS SOLVED (SHORT ANSWER QUESTIONS)|3 VideosGRAPHICAL REPRESENTATION OF DATA
FULL MARKS|Exercise TEST ASSIGNMENT|3 VideosDATA-ITS SOURCE AND COMPLIATION
FULL MARKS|Exercise ADDITIONAL QUESTION SOLVED (IV. VIVA-VOCE QUESTIONS)|8 VideosHUMAN DEVELOPMENT
FULL MARKS|Exercise Worksheet (Based on Chapter -4)|12 Videos
Similar Questions
Explore conceptually related problems
FULL MARKS-GRAPHICAL REPRESENTATION OF DATA-NCERT TEXTBOOK QUESTIONS SOLVED (ACTIVITY)
- Represent the following data with the help of suitable diagram. Indi...
Text Solution
|
- Represent the following data with the help of suitable diagram. Indi...
Text Solution
|
- Represent the followng data with help of pie- diagram. India: Land u...
Text Solution
|
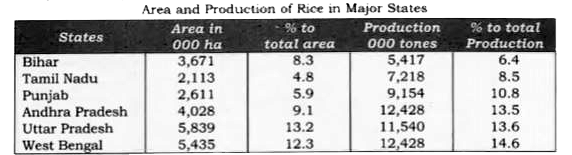
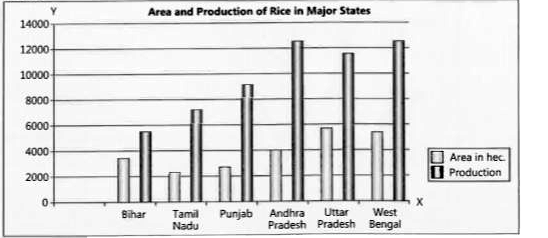
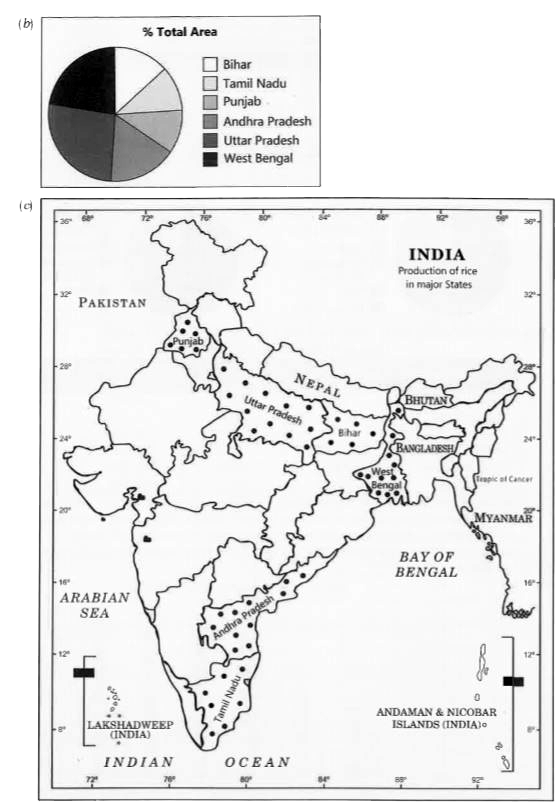
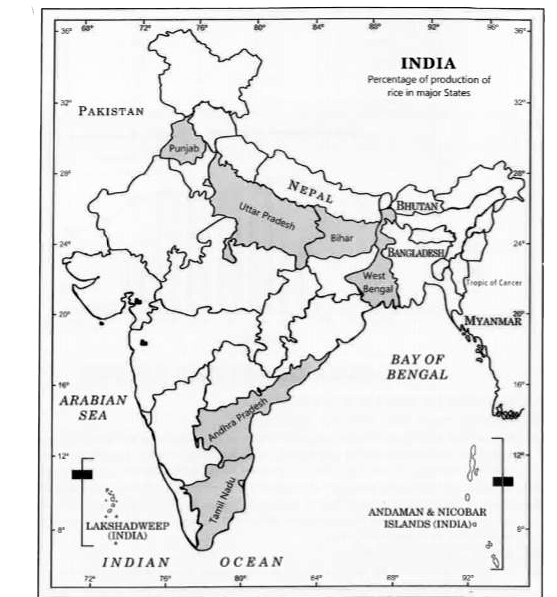
- Study the table give below and draw the given diagrams/ maps. Area a...
Text Solution
|
- Show the following data temperature and rainfall of Kolkata with a sui...
Text Solution
|