 .
.


Similar Questions
Explore conceptually related problems
Recommended Questions
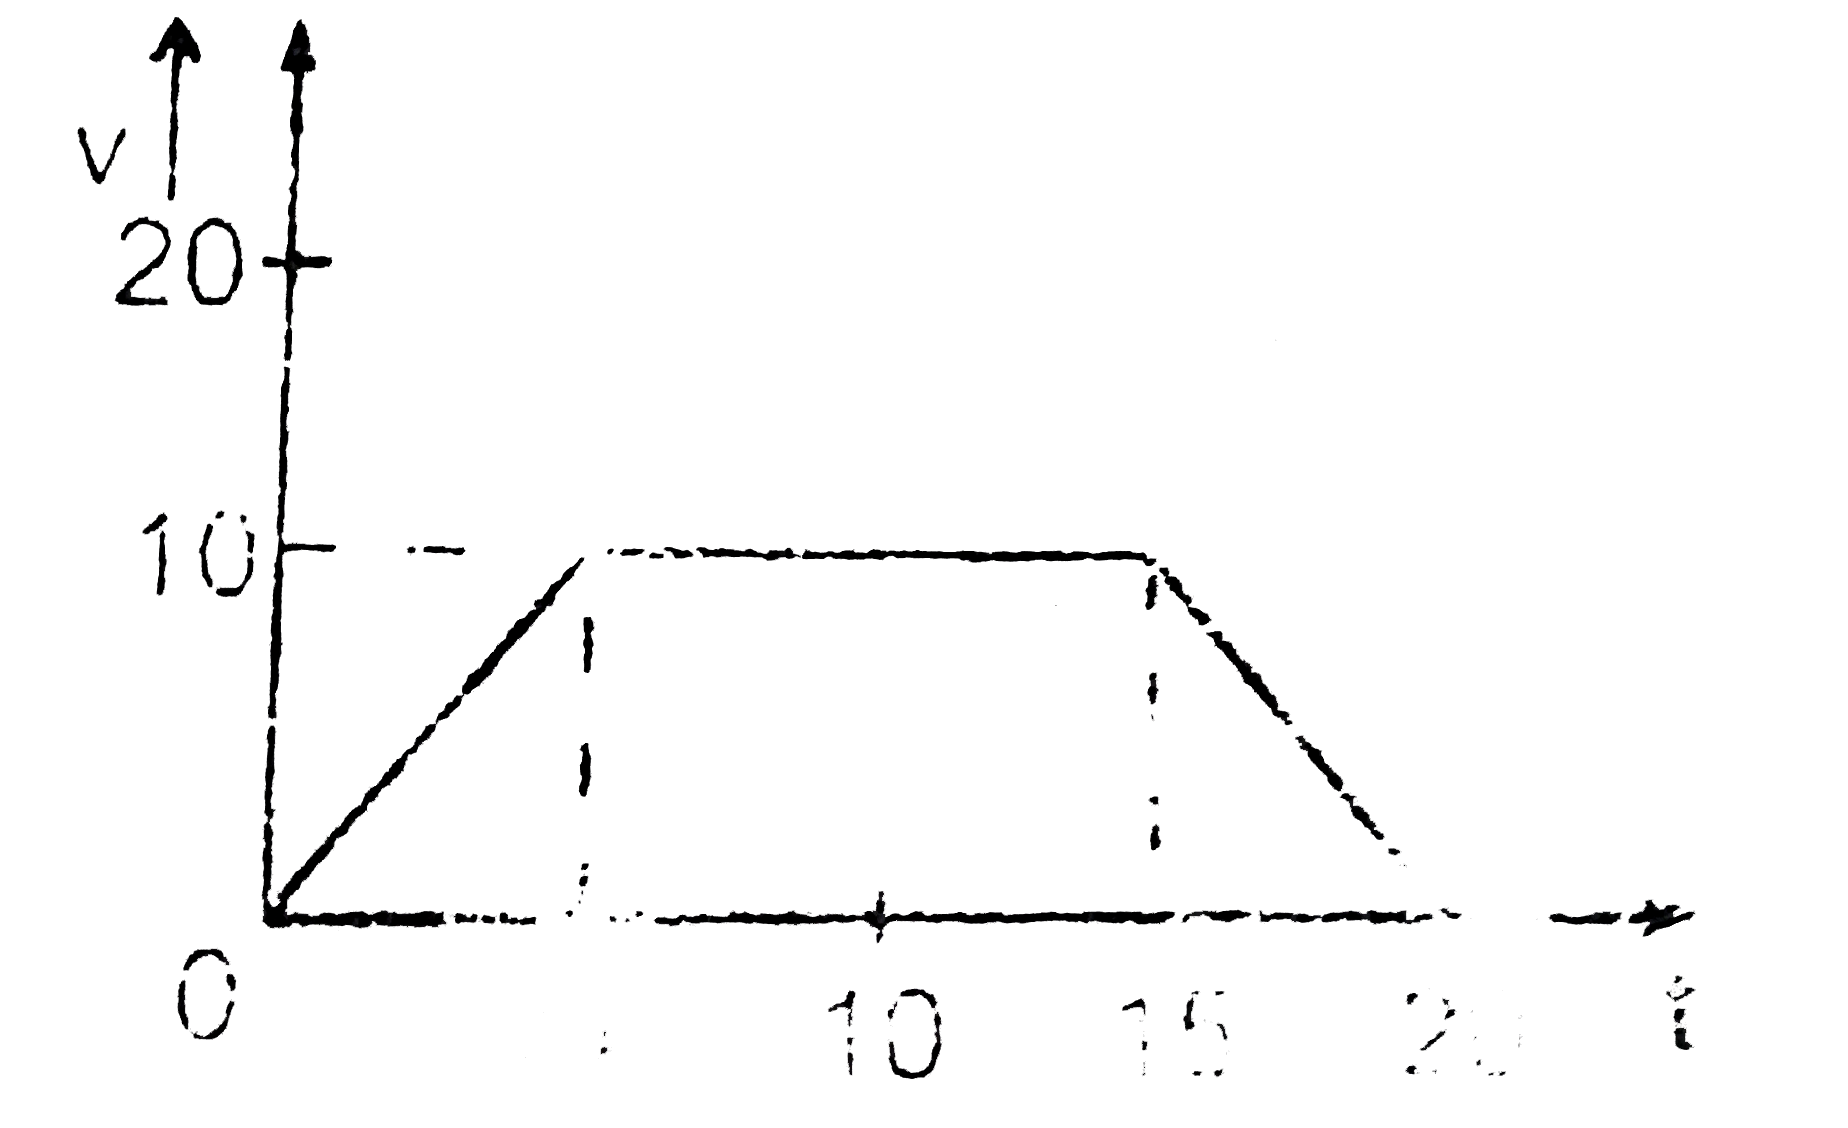
- Figure shows the velocity time graph of a particle moving along straig...
Text Solution
|
- A particle moves along a straight line and its velocity depends on tim...
Text Solution
|
- Figure shows the velocity time graph of a particle moving along straig...
Text Solution
|
- The velocity-time graph of a car moving along a straight road is shown...
Text Solution
|
- The velocity-time graph of a car moving along a straight road is shown...
Text Solution
|
- A particle moves in straight line in same direction for 20 seconds wit...
Text Solution
|
- The velocity-time graph of a particle moving along a straight line is ...
Text Solution
|
- सरल रेखा में गतिमान एक कण का त्वरण (a) समय (t) ग्राफ संलग्न चित्र में ...
Text Solution
|
- The velocity - time graph of a particle moving along a straight line i...
Text Solution
|